
Looking at North Dakota oil production by county, and historical production by county, gives a better perspective of what is happening in the Bakken and the rest of North Dakota than just looking at total production.
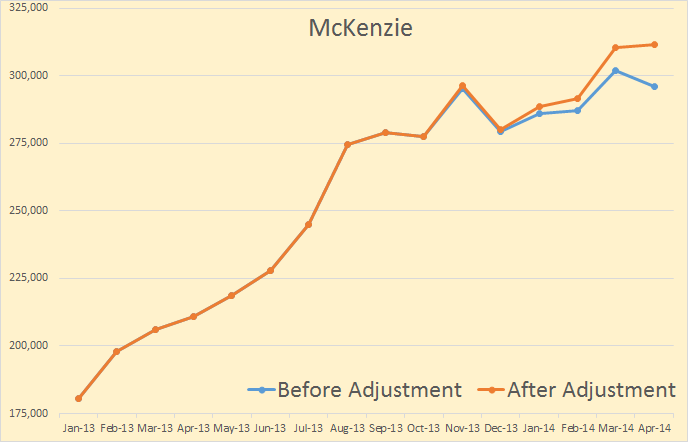
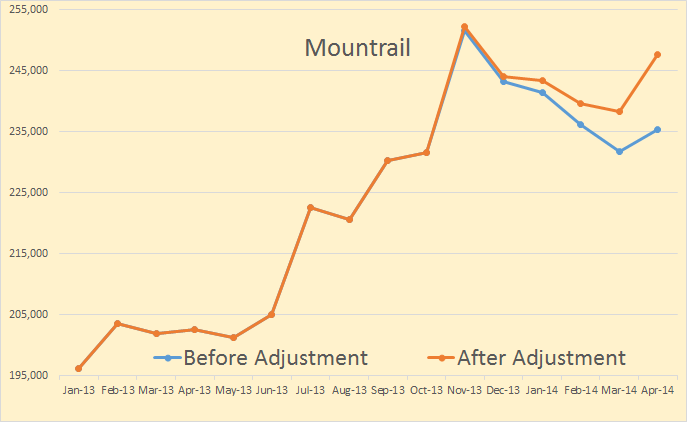
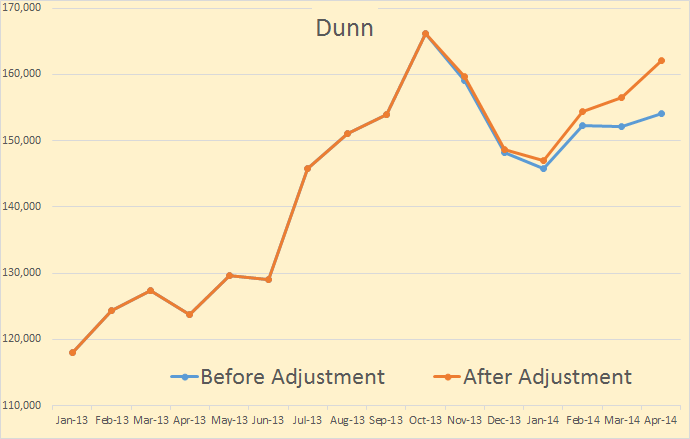
The data is available here: ND Historical Barrels of Oil Produced by County You will notice it says:(Confidential Wells are Not Included). However the total North Dakota does include confidential wells. I have simply took each counties percentage of the total, and added that percentage to their total and came up with a very close estimate to their final production.
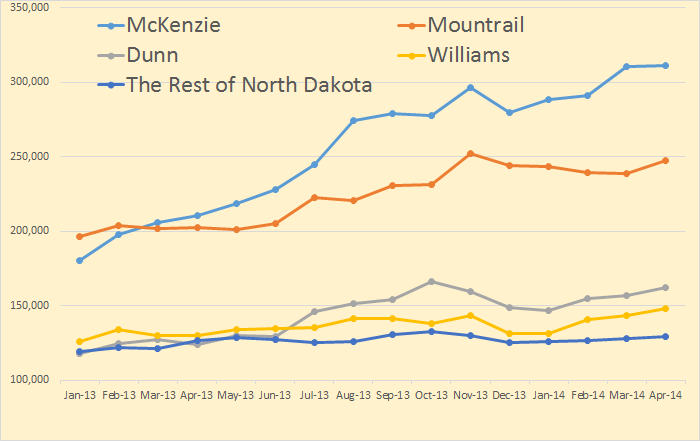
The above chart is after adjustment for confidential wells. Even the lowest producer of the big four, Williams County, outproduces the rest of North Dakota combined.
McKenzie surprised me a little this month. Although North Dakota production was up almost 24,000 barrels per day, their largest producing county was up only 942 bp/d after adjustment.
But the real surprise was Mountrail, up 9,222 bp/d after adjustment. I am confident that this high production, along with McKenzie is an anomaly. I will explain below.
Dunn County was up 5,544 bp/p after adjustment.
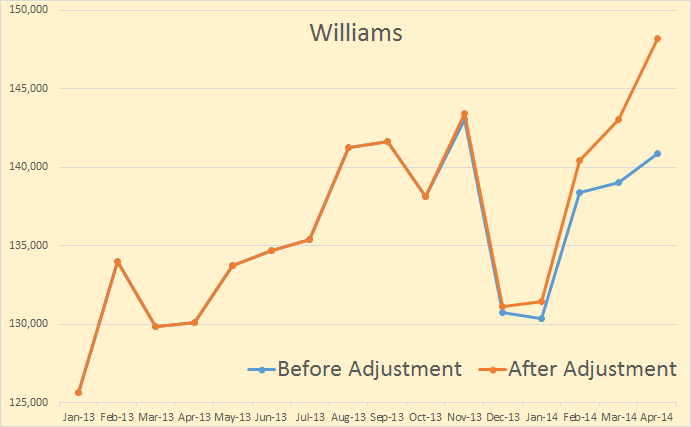
Williams County, the lowest producer of the big four, was up 5,135 bp/d after adjustment.
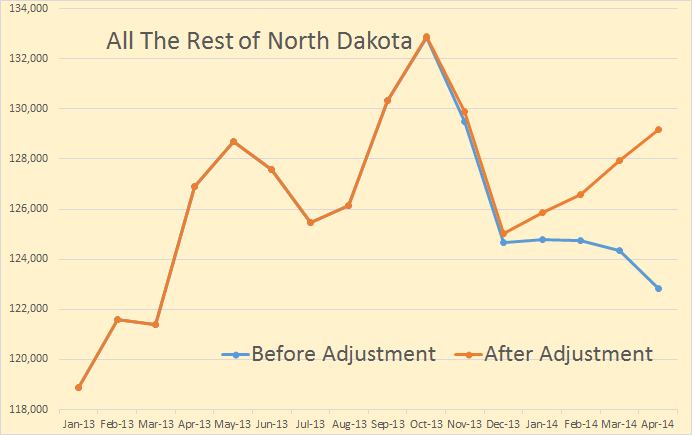
The combined production of all the rest of North Dakota counties was up 1,259 bpd after adjustment.
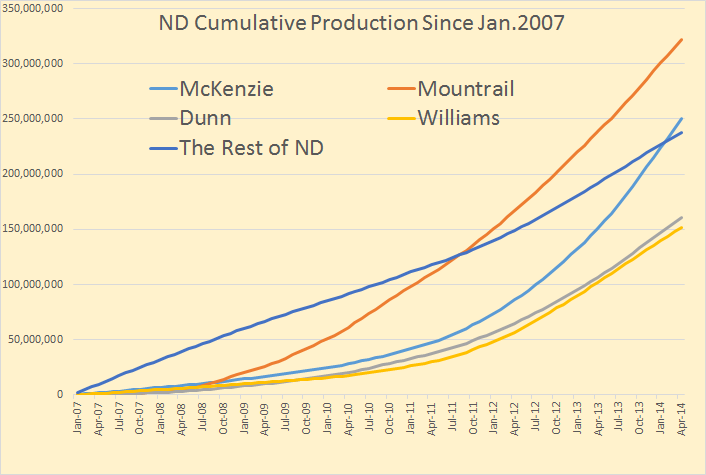
This chart is not total cumulative production but production since January 2007. 2007 is about the time, or slightly before the time, that heavy drilling and fracking started in the Bkken. From the start the big producer was Mountrail County and has, since 2007, outproduced McKenzie county by almost 72 million barrels. But Montrail county production has since slowed considerably.
Production in Mountrail County will continue to slow because only 17% of drilling rigs are working in that county while 37%, more than twice as many rigs, are working McKenzie County. 18% of North Dakota rigs are working Williams County, 14% are working Dunn County and 14% the rest of North Dakota.
The number of rigs in each county vary, but only slightly, from week to week.
A note of interest, North Dakota has produced 1,123,507,162 barres since January 1st, 2007.
On another subject, I had planned on a post based on the EIA’s Petroleum Supply Monthly which just came out. But it was pretty boring. The EIA is still estimating Texas production to increase 48,000 barrels per day month after month. And I think they are estimating Gulf of Mexico production way too high.
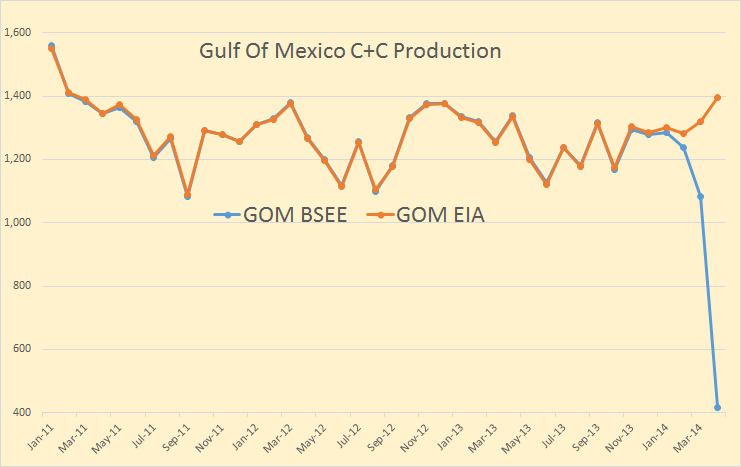
BSEE is a little like Texas RRC, their data is delayed. Except the RRC data is sometimes delayed up to two years where the BSEE data is pretty much in after three months. So the EIA just guesses at where the data will be when it all comes in. But I think that in the case of the GOM they are guessing way too high. They have the GOM up 38 kb/d in March and up 75 kb/d in April. They have US production up 165 kb/d in March and up 202 kb/d in April to 8,378,000 barrels per day. That seems a bit much.
The EIA is predicting the Gulf of Mexico will produce 2 million barrels per day by 2016. They may be trying to rush it a bit.
But there is finally something in MSM, The Washington Post in this case, that I can agree with.
James Woolsey, a former director of the CIA and self-proclaimed energy hawk, argues that the Organization of the Petroleum Exporting Countries (OPEC) has a grip on global oil and gasoline prices so tight that the United States will never be free of its influence. Like most people, Woolsey wrongly believes that OPEC is a powerful cartel.
In reality, OPEC rarely if ever influences its members’ oil production rate. It has almost no impact on prices, except under rare conditions. OPEC has been coasting on a reputation gained in 1973, perpetuating – and benefiting from – a myth about its own importance. It is long past time that myth was dispelled….
The real cost of the OPEC myth is political. Politicians in oil-importing countries blame OPEC for manipulating world oil markets, especially during times of high gasoline prices. For instance, NOPEC (No Oil Producing Exporting Cartels) bills have been introduced to the U.S. Congress over a dozen times since 1999, though none has passed. These bills distract Congress and the public, thereby imposing an opportunity cost on the political system and contributing to congressional paralysis. (Worse still, some politicians seem to know full well that OPEC doesn’t matter, but like a scapegoat for high prices.) The myth also causes U.S. diplomats to waste valuable political capital when they kowtow to various members of OPEC. Government officials are liable to defer to OPEC members and offer (modest) favors in exchange for changes in oil production.
All in all, the West would be better off if it stopped assuming that OPEC drives oil markets. It does not. Most of the credit or blame for rising oil prices in recent years rests with Asian customers, not diabolic moves by OPEC. With the price of oil set by market forces almost entirely outside of its control, OPEC is along for the ride like everyone else.
The article also points out that only Saudi Arabia has any spare capacity, that other OPEC members are pumping all the oil they can. Well… they were wrong on that point, at this time Saudi is also pumping all the oil they can.
rockman on Sun, 29th Jun 2014 9:20 am
A nice focus on the reality of the Bakken. I wish he had gone to the next logical step and express what his data implies. So I’ll stick my nose in and do it. I’m by no means an expert in the Bakken. But after 40 years of chasing oil/NG I do understand a few things about trend development. The first thing you learn is that there is no such thing as the “average production” of wells in a trend…which is often misused to predict future production. One can certainly do the math easy enough but that doesn’t mean it should be used as many do. The simple analogy: two tubs of water…one at 200F and one at 0F. So the “average” temp is 100F so it should be comfortable to stick your hand in either…right? Obviously not. Same dynamic when taking the average production of the sweet spot Bakken counties and project similar future production in counties where little drilling is currently happening.
The oil patch generally does a good job on focusing on the more productive portions of a trend. It was even easier to do in the Bakken because it wasn’t a new trend: it had been tested with vertical wells for 50 years before the horizontal boom began. That allowed the oil patch to focus on the sweet spots from the start.
So what do the optimistic Bakken “experts” do? They take drilling results of the best areas the companies concentrate on and assume similar future drilling results in the areas that the companies specifically avoid. A great example: about a year ago a well was drilled into an untested area where cornucopians would have done such an optimistic projection. Now I bet you think I’m going to tell you the well underperformed. I’m not. The well didn’t underperform. It didn’t perform at all: the Bakken formation wasn’t even present in this area. Amazing with a half century of drilling they didn’t know there was no Bakken in this area, eh?
Essentially they stuck their hand into that 200F water…ouch. But the averagers can take a well with no Bakken production and add it to a well that produces 400k bo. And…Ta Da! The average well in the two areas produces 200k bo. So they can take the area where there is no Bakken reservoir, divide it by the average unit size to give # future drill sites and proclaim # X 200k bo of future production…from an area where the Bakken doesn’t even exist.
Certainly simple “logic” any fool can follow…as many do.
ronpatterson on Sun, 29th Jun 2014 9:54 am
Rockman, I took the liberty of posting your comment on my site. I commented below it:
I had no idea that’s how they estimated the URR of the Bakken. However I am familiar with the wells I think you are talking about.
http://www.kxnet.com/story/20480884/chesapeake-drills-unsuccessful-wells-in-southwest-nd
But you did not stick your neck out far enough. How do you see Bakken production playing out in the next few years? Some “experts” see the Bakken peaking at about 1.2 mb/d within the next 12 months or so. I tend to agree with that assessment. Do you?
rockman on Sun, 29th Jun 2014 11:16 am
Ron – I think the data presented in this report could be the best induction of the future. Given these counties have produced the surge in Bakken production each person here can look at the plots and judge the future projections for those areas. I think most will project much of that activity will be falling off. And given the established high initial decline rates production in these counties will drop significantly as drilling falls off.
So how will future production in the rest of the Williston Basin play out in the Bakken? If one assumes the oil patch has been ignoring areas of the play that are just as sweet as what has been developed then the future looks bright. And if the oil patch isn’t brain dead then the optimists might be a tad too optimistic IMHO.
Nony on Sun, 29th Jun 2014 11:23 am
Rockman:
It is possible to quantify the effect you are talking about. It’s called standard deviation (population). 😉 Instead of noting some sort of binary “no variability” versus “variability”, one should attempt to quantify and compare and then interpret the implications economically.`
It’s not a news flash to induatry vets or even good amateur observers. You set up a strawman to argue against.
If you look at that, you will find that in some ways, the Bakken is much more regular than vertical drilling looking for regular traps. So beware of making too much reliance on all your old intuitions. Instead quantify std deviation from play to play and discuss that.
When I hear the earning calls (have listened to several now), both the analysts and executives seem very familiar with the concept you are mentioning (sweet spot, defining boundaries, de-risking, etc.) They’re noit dummies. They’re old salts too. They’re not even chalatans.
Yeah, they’re not going to be negative on an earnings call…but you can still get a lot of insight and people discuss things with surprising sophistication (better discussion between some Goldman analyst and a VP of exploration than the commenters here, acting all peaker Internet commenter smug.)
Also, there’s a substantial difference in infill drilling and stepout drilling. And a substantial amount of what is going on now is infill drilling. That’s a much more known situation (and yes, there’s limits on cost/benefit of infill drilling also…but it sure ain’t wildcatting…it’s dealing with known conditions. And the industry has done many pilots to look at infill drilling limits.
If you really want to keep it real, don’t flay the strawman. Go after Piccolo and Rune for their flawed peaker-low estimates and their lack of facing up to how they were wrong…low!
rockman on Sun, 29th Jun 2014 11:23 am
I just remembered the happiness cycle of a turkey. Life for it runs a fantastically wonderful linear path. Just like the linear path the Bakken has followed so far. And then Thanksgiving rolls around and life for the turkey abruptly turns to crap.
So how close is the Bakken to its “Thanksgiving Day”?
Nony on Sun, 29th Jun 2014 11:30 am
Rock,
To what extent do the future projections depend on infill drilling and to what extent on stepouts from the sweet spots?
BTW, if you count Canada and Montana, we’re probably already at 1.2 million. But I do agree we might as well keep the discussion to ND Bakken-TF only (the reported number from the director’s cut). Where do you see that peaking? Rune and Picollo have already been shown to be way too pessimistic. Even some of the old optimistic forecasts (ND state from a couple years ago) have been exceeded. Sure…at some point, we will turn and surely there will be some forecasts above where we turn. Like the 2 million from Goldman or whatever. But so far…the gold hard data has been kicking skeptic butts. Oh Rune…
Nony on Sun, 29th Jun 2014 11:51 am
Oh…and Marcellus 1, Berman 0.
http://energyindepth.org/wp-content/uploads/2014/02/EIA-Marcellus-gas-production-increase.png
14 TCF!
rockman on Sun, 29th Jun 2014 12:04 pm
Nony – Standard deviations only apply to the population being analyzed. Those portions of the trends not being actively drilled are not part of the population being studied (the currently developing counties). Why not be a real chum and draw us some charts of the other counties where the Bakken has been drilled. That would be a great way to prove your point IMHO. I think much better then just saying you’re right and I’m wrong.
IOW what’s the SD of the Bakken production in the area where the formation doesn’t exist? LOL.
Steve on Sun, 29th Jun 2014 12:19 pm
Rock are there other areas that have not been discovered…or is most of the recoverable oil already known….and where do oil companies go from here? Maybe that does not make sense is there a chance of still finding a huge oil field somewhere we don’t know about….
Nony on Sun, 29th Jun 2014 12:20 pm
I got that the first time you said it, chum. 😉
Then I talked about infill drilling and how it was not news to anyone in the industry that talks about sweet spots, stepout, derisking, etc. But have fun killing strawmen in front of the Internet commenters.
Northwest Resident on Sun, 29th Jun 2014 1:36 pm
Nony — You took a long vacation from posting on this site, now you’re back. In many of your previous posts from a couple months or so ago (or further back), I couldn’t help noticing that you get much if not all of your “optimistic about shale oil and NG” information from financial/investment websites, links to which you posted. Is that still the case? You are a fierce defender of the “shale oil revolution and American NG glut” fantasy that the MSM and especially financial “news” sites deliver to the adoring masses 24/7/365. You’re obviously smart enough to learn a few oil-related terms and concepts, but are you smart enough to analyze the real data to its logical conclusion? As far as I can see, the answer to that question is “most definitely not”. But hey, welcome back. I enjoy your whacky sense of humor and your unbridled faith in a world powered by shale “oil” and NG as far into the future as the imagination can see. It is fun seeing how a person so ultimately self-assured and cocky can be so totally wrong about just about everything. Keep the humor coming, chum!!
Nony on Sun, 29th Jun 2014 2:22 pm
I’m banned, Rock. Sorry. 🙁
Nony on Sun, 29th Jun 2014 2:26 pm
Hmm…or spam-killer was cutting my posts. (Don’t make the obvious joke. ;))
Anyhoo…I was actually responding to Rock with a quantitative point. If you look at Enno’s cumulative curves, the new well profile has not changed for the last few years and is better than that of 2008, 2009. In other words, whatever the concern is (having to step out to new areas, infill drilling leading to communication), it is not yet impacting production. Of course, I recognize these effects exist. But bottom line is…they are not showing yet.
P.s. It really is a straw man to talk about the rock varying in quality throughout the play. Every company discusses this readily on their conference calls.
Nony on Sun, 29th Jun 2014 2:27 pm
NR: I appreciate your tolerance of me. Go Skins, beat ‘hawks.
Nony on Sun, 29th Jun 2014 2:52 pm
Rune has a post on this topic as well. (Can’t post link.) Quick assessment by me:
1. Fails to mention his own failed prediction (much ballyhooed and ran twice at TOD). I actually wouldn’t grind the guy if he just fessed up. But the opposite is bad, bad, bad.
2. The finance stuff is confusing, how he mixes it randomly with the geological assessment, should be one than the other.
3. Not convinced of the finance analysis (actually hard to understand his point…but FWIW, looking at short term treasuries is not as meaningful as looking at B- long term (and that is plottable). The junk bond price is what matters. Also, the free cash flow stuff with all the caveats seems off, unless the point is just that investment continues to outpace return, in which case, um…OK.
4. At the end there is a peak call of 1.1MM for 2014. Not seemingly reflecting anything in the article, but labeled as a summary. It’s actually fine if that is his intuitive impression (Bayesian guess). But just label it as such. And it’s not a “summary”.
gerard mchale on Sun, 29th Jun 2014 3:55 pm
Greetings, Rockman. I offer you my deepest respect and admiration for the graciousness and patience that you displayed to the many anxious commenters on TOD during BP’s GOM blowout a few years back.
A couple of brief observations on this post …
The four counties mentioned are larger in combined area than New Jersey.
The oft-described sweet spots have been almost entirely drilled by one or two wells for retention purposes (Held By Production) on their one to two square mile Drilling Spacing Units.
The long-anticipated downspacing development has just begun with Continental having two pads – the Hawkinson and Rollefstadt – showing IP’s of 14, 000 and 24, 000 boepd. Of possibly more significance is that the distance between laterals was 1, 320 feet. Their current pilot pads are spacing laterals 600 feet apart. Carrizo just successfully did an 8 well test in the Niobrara with 200 foot spacing.
This is occurring with the continuing evolution of fraccing with the emphasis on bigger, more numerous, yet shorter, induced fissures.
Makati1 on Sun, 29th Jun 2014 8:26 pm
Northwest, some on here have not yet learned to look at the source of the info/article before assessing it’s value. Today. even more than in the past, lies are common and often disguised as ‘facts’ coming from some source dependent on the success of the subject and often listed as an “expert” with a long list of alphabet degrees after his/her name.
If it comes from a financial/investment site, it is to keep you in the game or to get your last dollar before it collapse’. If it comes from an “expert”, are they selling a book or a seminar? If it is government sponsored … well…
Nony on Sun, 29th Jun 2014 9:09 pm
I think you are making a big mistake by only getting info from your comfort circle from the TOD hanger ons. Look and learn from everything. Ralph Eads is a slippery character…sure be wary of him. But you can also learn a HELL of a lot by listening to him. You have to be eclectic. Listen to all kinds of music and take the good and ignore the bad.
Yeah…I have not learned the superiority of postings about Mike Ruppert’s death (or Gail’s sharkfins) over the huge amount of content in the ND online site or say…the CLR 10-K.
(I downloaded that, printed it…and read it. Lots of educational stuff about reserves accounting, NPV-10, proven versus unproven. I’m not even getting into the view of the Bakken or CLR. Just to know the basics…it was better than this site (no offense…don’t hurt me, Hammer).