Keeping Oil Production From Falling

Production flows from a given oil field naturally decline over time, but we keep trying harder and technology keeps improving. Which force is winning the race?
An oil reservoir is a pool of hydrocarbons embedded and trapped under pressure in porous rock. As oil is taken out, the pressure decreases and the annual rate of flow necessarily declines. A recent study of every well drilled in Texas over 1990-2007 by Anderson, Kellogg, and Salant (2014) documents very clearly that production flows from existing wells fall at a very predictable rate that is quite unresponsive to any incentives based on fluctuations in oil prices.
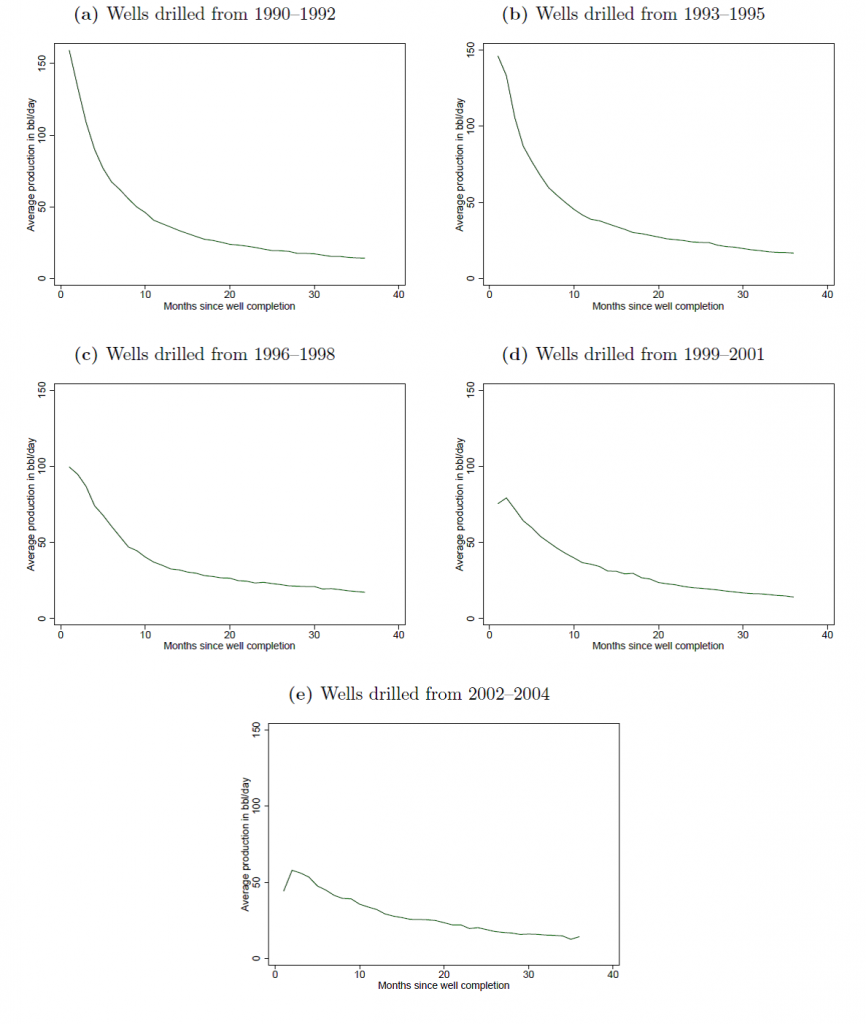
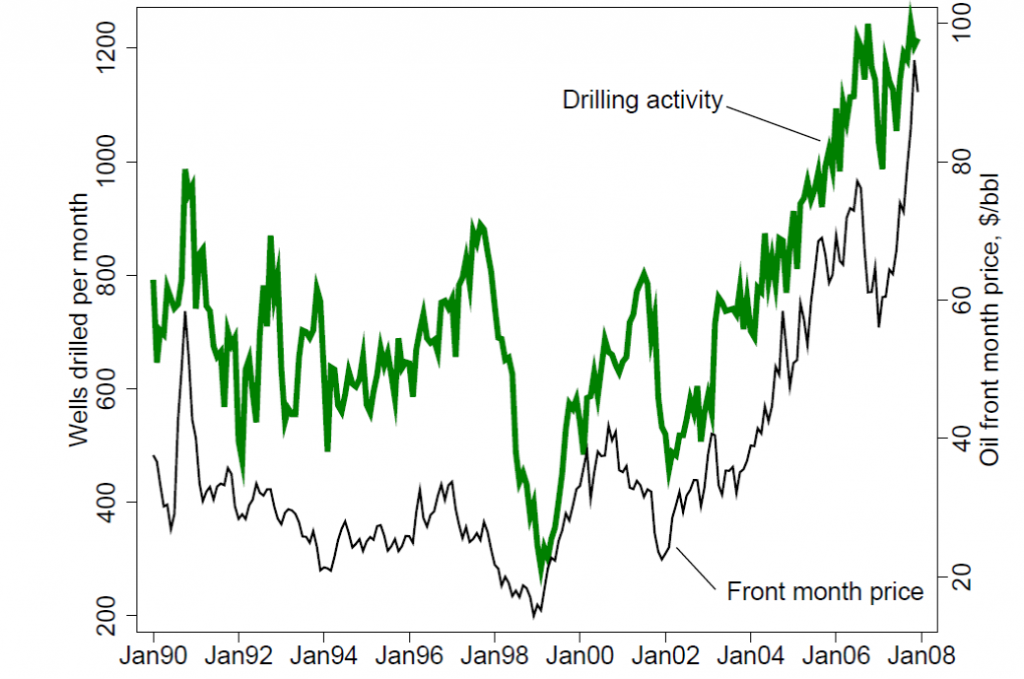
If you want to produce more oil, you have to drill a new well, and in contrast to production from existing wells, drilling effort clearly does respond to price incentives.
When a given region is found to be promising, more wells are drilled, and production initially increases. But eventually the force of declining pressure takes over, and we see a broad decline in oil production from a given producing region that additional effort and price incentives can do little to reverse. For example, production from the North Sea and Mexico, which had been quite important in the world total in 2000, have been declining steadily for the last decade despite a huge increase in the price of oil.

It’s also interesting to look at graphs for each of the oil-producing U.S. states. Production from Pennsylvania, where the oil industry began in 1859, peaked in 1891, and in 2013 was at a level only 1/6 of that achieved in 1891. But despite falling production from Pennsylvania after 1891, U.S. production continued to increase, because of the added boost from Ohio (which peaked in 1896) and West Virginia (which peaked in 1900). And so the story continued until 1970, with total U.S. production continuing to increase despite declines from the areas first exploited.


The table below lists the date at which production from an indicated state reached its highest point. Use of horizontal drilling methods in the Bakken and Niobrara shales brought production in North Dakota and Colorado to all-time highs in 2013. Production was also higher in 2013 than in 2005 for 22 of the 31 states graphed above, though 2013 levels were still below the historical peak for all but 3 of these states.
|
STATE
|
|
DATE OF PEAK
|
| Pennsylvania |
|
1891 |
| Ohio |
|
1896 |
| West Virginia |
|
1900 |
| Arkansas |
|
1925 |
| Oklahoma |
|
1927 |
| New York |
|
1937 |
| Illinois |
|
1940 |
| Indiana |
|
1953 |
| Kansas |
|
1956 |
| Washington |
|
1957 |
| Kentucky |
|
1959 |
| Nebraska |
|
1962 |
| Arizona |
|
1968 |
| Montana |
|
1968 |
| New Mexico |
|
1969 |
| Mississippi |
|
1970 |
| Wyoming |
|
1970 |
| Louisiana and GOM |
|
1971 |
| Texas |
|
1972 |
| Utah |
|
1975 |
| Florida |
|
1978 |
| Michigan |
|
1979 |
| Alabama |
|
1980 |
| Tennessee |
|
1982 |
| Virginia |
|
1983 |
| Missouri |
|
1984 |
| California |
|
1985 |
| Alaska |
|
1988 |
| Nevada |
|
1990 |
| Colorado |
|
2013 |
| North Dakota |
|
2013 |
| South Dakota |
|
2013 |
| U.S. total |
|
1970 |
Another perspective on the U.S. trends comes from looking at broader categories of production. The red area in the graph below summarizes field production of conventional crude oil from the lower 48 U.S. states. This peaked in 1970, and today is 5.5 mb/d below the value achieved then. Factors temporarily slowing the trend of declining production were development of offshore oil (in dark blue) and Alaska (in light blue). But the combined contribution of all three of these has nevertheless been falling steadily for the last 20 years.
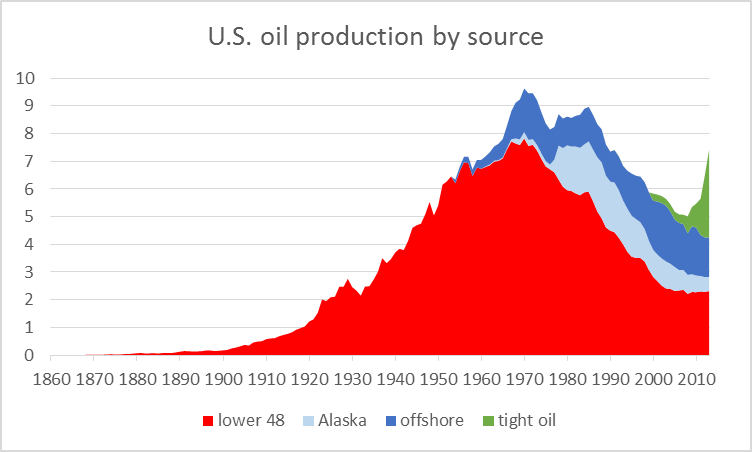
That downward trend was dramatically reversed over the last few years with the advent of horizontal drilling and fracturing to get oil out of tighter geologic formations, as seen in the green region in the graph above. If success with tight oil formations continues, we may yet see the historical peak production of many of the states above eventually exceeded, and indeed perhaps even for the United States as a whole.
But it’s also worth noting that as we moved through the succession of colors in the graph above we have been turning to increasingly more expensive sources of oil. Today’s frackers would all be put out of business if we were to return to the oil prices of a decade ago.
And even if prices remain high or go higher, eventually that green curve is going to turn around and start falling with the others.
Econbrowser


Makati1 on Tue, 22nd Jul 2014 7:52 am
The recovery of real petroleum has been declining for decades. Net energy produced, per capita, has also been declining for at least as long. Never any mention of that in the ‘news’ though. Too depressing and the market casino would crash and never recover.
BTW: We do not “produce” oil, we recover it. Mother Nature produced it hundreds of millions of years ago.
Dredd on Tue, 22nd Jul 2014 8:57 am
“Which force is winning the race?” – Econbrowser
I do not see it as a “race” nor is there any “winning,” there is only “depletion.”
Anyway, the arithmetic is a winner.
Let y = extraction i.e. production, and be >0.
Let x = the finite amount of procurable oil at any given time (< ∞).
Let z = the total amount extracted.
Let the operation be: z = x – y
============
The answer z depends on how many recursive iterations of the operation can take place before x = 0.
In our current, non magic reality, z cannot ever be ∞ because x is never ∞
Northwest Resident on Tue, 22nd Jul 2014 9:55 am
What the little green part of the graph doesn’t show us is how much conventional oil is required to get that magnificent little burst of upward trending green. If we knew that it took two barrels of conventional oil to extract, ship, process and deliver to market three barrels of tight oil, then we wouldn’t be so impressed, would we? All of that “impressive” tight oil production hides the fact that the cost (in conventional oil and investment) to get the tight oil means we end up with a very slim margin of net energy increase, if any.
Plantagenet on Tue, 22nd Jul 2014 10:27 am
incorrectly says that North Dakota peaked in 2013. That isn’t true. Oil production due to fracking continues to grow in ND.
It will peak someday, but it hasn’t yet.
JuanP on Tue, 22nd Jul 2014 10:52 am
They do make Rock’s price argument and I liked that colored graph. Two things from that graph stand out for me. The first is that that green growth shoots up faster than any other color before it. The second is how the decline in the red area representing the lower 48 states stopped as prices increased and that line has been almost horizontal for many years, since around 2000, just about the time prices started coming up; impressive.
I disagree with the author’s conclusions.
JuanP on Tue, 22nd Jul 2014 10:57 am
Conclusions regarding increased production in many states. The rest of his conclusions are reasonable.
JuanP on Tue, 22nd Jul 2014 11:01 am
NWR, Your point about energy is very good but lost on 99% of people. He at least mentioned increasing costs. Things like EROEI and net energy are for nerds like us, not the masses.
JuanP on Tue, 22nd Jul 2014 11:05 am
Plant, The paragraph above the list explains that these numbers are up to now. I don’t read it as meaning production there has stopped growing forever. The author later adds that production could increase throughout the USA under certain conditions, something I disagree with.
M1 on Tue, 22nd Jul 2014 11:12 am
Better yet, simply avoid the problem, by switching your fleet to EV’s and hybrids, now.
Solar contracts now down to 5 cent per kWh.
Coal, nuclear and natural gas are now dead.
Also, get out of your index fund, because they’re heavily weighted in the loser coal, and carbon industry. Buy into a clean energy index and ride the wave of the future. Avoiding the S&P 500 death spiral.
tahoe1780 on Tue, 22nd Jul 2014 12:22 pm
Would have liked to see a graph of fracked wells drilled and their depletion rates.
shortonoil on Tue, 22nd Jul 2014 1:19 pm
The title of this article is an oxymoron. The simplistic reason is that the cost of producing petroleum, and its products will keep increasing. That is as assured as the sun will rise tomorrow, or that a cup of hot coffee set on a table will cool until its temperature reaches that of its environment. It is a fact guaranteed by the irrefutable laws of physics!
Oil has now hit $100/barrel, and world growth has ceased. The only illusion to growth is now coming from the massive amount of currency being printed by the world’s central banks. Every other reliable indicator is showing that world economic growth is no longer occurring. We have reached the end of this phase of the oil age, and that occurred at about $100/barrel.
By our calculations the total cost of operating the world’s petroleum infrastructure in 2012 accounted for 17.5% of the world’s GDP. $4.1 trillion of that was paid for when the end consumer purchased the product. The balance was spent on roads, military, education, regulation, and the maintenance and depreciation of the the world’s IC fleet. Although petroleum offers a huge societal benefit, it is also a huge societal cost. Regardless, its tremendous energy delivery capability has been the primary driver of economic growth for the last century.
With zero growth in the general economy the only increasing demand for petroleum, and its products is now the petroleum industry itself. But the increasing demand from the petroleum industry can not increase at a rate faster than the demand from the general economy declines. In the meantime the cost of production keeps increasing, and so also will its price. If there is any increase in production it can only come because lower quality hydrocarbons are being used, and it requires more of them to fulfill the society’s energy needs.
As the cost of producing petroleum, and its price ratchet ever upward, the world’s economic system shuts down. One more price doubling should conclude the present system. After that production collapses. Illusions of continuing the world’s petroleum production at its present rate is an exercise in futility.
http://www.thehillsgroup.org/
sparks on Tue, 22nd Jul 2014 1:56 pm
Long time lurker here — first post. The above post by shortonoil is the most succinct and articulate summing up of the world petroleum situation that I have yet encountered on websites such as this. So thank you, Short, for your always high quality contributions to the discussion, and please keep it coming.
Spec9 on Tue, 22nd Jul 2014 5:25 pm
The ONLY reason for that spike in tight oil is that the price of oil tripled from around $30/barrel in 2002 to the present times of around $100/barrel. We are just extracting more expensive oil. Thus, despite our increased production, the price doesn’t go down.
Craig Ruchman on Tue, 22nd Jul 2014 5:38 pm
Very informative! I would love to see a similar post showing the production of each country all together on one page. As long as there are a few areas that are increasing output, there is something for the cornucopians to hold on to.
fred1 on Wed, 23rd Jul 2014 1:57 am
I would have to agree with sparks shortonoils post basically explains the predicament we will all be facing soon
Perk Earl on Wed, 23rd Jul 2014 3:25 am
“One more price doubling should conclude the present system.”
Or, a price division. Short, cut the price to 50 dollars a barrel via a deep recession and most of that non-conventional production becomes uneconomical, reducing oil supply to the point of crippling the world economy.
I know, you’re thinking a low price would stimulate economic growth, but not if supply is insufficient. Oil could be further subsidized but that forces more fiat printing.
I’m of a mind that the price of oil is teetering just below and above disaster. Raise or lower it much from where it is and knock on effects ensue that worsen the current economic situation enough to cause another step down, aka 2008/2009.
marmico on Wed, 23rd Jul 2014 5:56 am
So gasoline expenditures have risen ~$200 billion since the millennium t is Big deal in a $17 trillion economy.
Davy on Wed, 23rd Jul 2014 6:04 am
Perk, you are right growth will not increase with a lower recession influenced oil price because we are in the beginning of a global debt unwind. We will not see an increase in fiat money printing like we did post 2008. The system is already unable to properly make the whole mechanism work. There is much more than money printing to money printing. This printed money has to be integrated properly. The fed is unwinding, Europe is defaulting, and china is realizing bad debt in a dangerous way. You are describing the classic “goldilocks range” for oil of which oil is on a knife edge either way away from uneconomic.
marmico on Wed, 23rd Jul 2014 6:44 am
By our calculations the total cost of operating the world’s petroleum infrastructure in 2012 accounted for 17.5% of the world’s GDP.
Show your calcs. World GDP is ~$75 trillion at market exchange rates or ~$85 trillion at purchasing power parity rates. Petroleum infrastructure is not $[($13-15 trillion)- $4.1 trillion] $9-11 trillion. You are overreaching by a half an order of magnitude.
Davy on Wed, 23rd Jul 2014 7:14 am
Marmico, if or if not that figure is inflated would you not agree world GDP is inflated to include a huge amount of nebulous products related to the service industry namely FIRE. If you get down to real assets and real productive activity world GDP in significantly less. At that point then compare the heavy lifting the global oil industry does and you get an appreciation of the amount of real effort and energy involved. This number then can be further increase with the rest if the fissile fuel industry
marmico on Wed, 23rd Jul 2014 8:13 am
Davy, I’m not following your analogy that consumption of a “real” nondurable good like gasoline is significantly or appreciably more important than a “nonreal” service like health care.
U.S. households spent $200 billion more on gasoline in 2014 than they spent in 2000. Likewise, they spent $600 billion more on health care.
FRED
The damn cost increases in health care for the rocking chair old farts populating this website is just dooming the country. 🙂
Davy on Wed, 23rd Jul 2014 8:29 am
M, you get the point. The main point is finance, tourism, modern art (tv), unnecessary media, unnecessary developement, excessive consumerism, and excessive military. Remove these and many others and we get a true picture of activities required to survive. In this subset the variable called energy is near the top and growing. IMA healthcare is excessive with a huge amount spent on the last 6months of life, unnecessary procedures, unnecessary facilities, overly complex equipment, and bloated administration.
marmico on Wed, 23rd Jul 2014 8:47 am
D, no I don’t get your point which just boils down to argumentative, nebulous, nonmeasurable personal preferences. And I don’t get Hill’s (shortonoil) point because it is measurably wrong.
Davy on Wed, 23rd Jul 2014 9:25 am
M, maybe because we are at the end of different spectrums. Your argument is cornucopia in orientation and mine is distilled being a doomer. I also believe you do get my argument as I get yours both valid.
Northwest Resident on Wed, 23rd Jul 2014 9:38 am
sparks — I agree. Nobody nails it better than shortonoil.
marmico on Wed, 23rd Jul 2014 9:47 am
D, of course there is a spectrum of preferences. But to suggest that a millennial couple with preschool children are “tourism” morons because they visit Orlando is beyond the pale.
I await to engage shortonoil’s calcs after he recovers from his gerontologist visit. 🙂
P.S. Hamilton’s chart is way out of date. Add a million b/d to the green stack.
Nony on Wed, 23rd Jul 2014 9:51 am
The futures curve shows oil price dropping. And the history of oil has gyrations of short and long duration. So Shortonoil is just pontificating without basis when he says the price will go up ‘without a doubt’. There’s plenty of room for doubt. In fact, the betting money (on the markets, heck even the Pops thread) is that prices decline.
Davy on Wed, 23rd Jul 2014 9:54 am
M, I think you are putting words in my mouth friend but I accept your view. I will say this, Short’s post are among the most respectable and accurate on this forum coming from in depth analysis. So, M, you better bring more than a knife to battle Short:)
marmico on Wed, 23rd Jul 2014 10:30 am
Shortonoil is full of hubris (shit) if his models indicate that petroleum infrastructure is 17.5% of world GDP. Period.
I’ll know his world is coming to fruition when Pfizer whines about the petroleum input cost to produce Viagra and Lipitor for the peakoil.com rocking chair old farts.
JuanP on Wed, 23rd Jul 2014 10:35 am
Davy, I agree with your main point and your observations about health care in the USA and will add inadequate, immoral, and inefficient to the list of deficiencies the system has. We spend more than any other country in health care and have like 50 million people with limited access to essential services. We could reduce GDP by 10% and improve people’s lives by reforming the health care systems. Talk about low hanging fruit, this one is on the ground.
marmico on Wed, 23rd Jul 2014 10:44 am
Yo Nony, are you, like me, still banned from Ron “Stock Broker” Patterson’s gin mill?
Nony on Wed, 23rd Jul 2014 10:58 am
Yeah, but it’s OK. Please leave it be. I am OK with it and with him. Really a good site in some ways. Wish there was a site full of DCs and Ennos and Rockmen. But just doesn’t exist. The shale blogs are all awfully commercial and don’t have much community. I quite like Million Dollar Way, but it also lacks a community.
Lately, I have listened to the 45 minute videos on the Marcellus at PSU extension. They are top notch. Way more content than the articles here. Really recommend them. RBN Daily is kind of cool too. And Drilling Info.
Unfortunately, still nothing that really has the right content for amateur oil followers. Wish there was a TOD that slanted more to the center, or even to cornie. Want to be able to discuss the Bakken, TMS, etc. Maybe a forum.
marmico on Wed, 23rd Jul 2014 11:10 am
Please leave it be. Sure. But Dennis Coyne can produce fantastic charts on short notice. I’ll get him to 1.5 mb/d in the Bakken! 🙂
What can realists do? There is no middle ground between doomers and cornies. Both groups are sell siders, backwardation be damned.
Northwest Resident on Wed, 23rd Jul 2014 11:15 am
Nony — A forum that is specifically dedicated to the wonders of shale oil, and more specifically to Bakken, TMS, etc… would be perfect for you, because that’s generally all you post about anyway. It would have to be a pro-fracking forum that sings the praises of NG and all things related to shale oil, and that ignores or discourages discussion on any of the inconvenient facts related to shale oil and NG. I wish there was a forum like that for you.
You and marmico know each other and are both banned from some other blog/website? What a surprise! I can’t imagine why you guys would be banned from a website/forum, except that you’re both exceptional rude and crude, make outrageous and provocative statements and are frequently off-topic. Other than that, why would they want to ban you?
Nony on Wed, 23rd Jul 2014 11:48 am
We’ll probably crack 1.2 MM bpd in the ND Backen by November (reported). 1.5 by late 2015 or summer 2016 (have the winter turndown to deal with).*
That play is not held back by depletion or debt or logistics. Price crash would turn it off, of course…but a price crash would be good for consumers.
It’s looking more and more like the McKenzie Wood, Goldman Sachs, Magueri, etc. forecasts make sense. I read some of the old posts at TOD and here yesterday. Most of the frequent peaker commenters talked the Bakken down. (Comments like ‘won’t make a difference, US overall will not rise from 5 MM bpd, won’t make up for Alaska decline’) If they admit they were wrong, then that’s fine, I move on. When they don’t, then it makes me not trust any other analyses from them.
*Analysis based on linear extrapolation (admitting the lack of science).
marmico on Wed, 23rd Jul 2014 12:02 pm
Thanks for your (un)intellectual efforts, NWR. Pop a Viagra and Lipitor and post a “selfie” of your big hard on for Nony and me, you mental midget (“dipshit”}.
You rocking chair old fart doomers internetting in a virtual echo chamber (“nonreal” excessive consumption) should start to accumulate “real” Preparation H by the case because in 2016 U.S. oil production will exceed the prior 1970 peak?
Ban my outrageous and provocative statements!
Nony on Wed, 23rd Jul 2014 12:12 pm
Calm down, marmie. I know how you feel, but they will bring the banhammer down faster on a cornie who says something personal than a doomer who does. NWR is a nice guy.
Davy on Wed, 23rd Jul 2014 12:28 pm
M, I take it you have ED by your repeated mentioning of ED meds. It is ok to be young and have that problem. This might explain your piss and vinigar attitude. You know, make up for deficiencies with the ladies by being tough and macho. Cool, we can except that here being old farts we have seen it before.
Northwest Resident on Wed, 23rd Jul 2014 12:37 pm
marmico — If ever we meet, you’ll realize how totally inaccurate your characterization of me is. Words like that coming from a mental midget like you just make me laugh. Keep up the obnoxious and idiotic posts — it is who you are.
Northwest Resident on Wed, 23rd Jul 2014 12:42 pm
Nony — Thanks for the support. But let’s face it, nobody — and I mean nobody — gets banned from the general comments section of this forum. Which is why we end up with a lot of slithering cockroaches coming here to post their obnoxious and lunatic crap — they’ve been banned from everywhere else. Its okay — the marmico poster doesn’t phase me — the internet is packed with obnoxious goofballs, they’re a dime a dozen — actually, much less than that.
shortonoil on Wed, 23rd Jul 2014 12:59 pm
“Show your calcs. World GDP is ~$75 trillion at market exchange rates or ~$85 trillion at purchasing power parity rates. Petroleum infrastructure is not $[($13-15 trillion)- $4.1 trillion] $9-11 trillion. You are overreaching by a half an order of magnitude.”
You can find that in our 57 page report, “Depletion: A determination for the world’s petroleum reserve”. We are a privately financed group, and even though we send the report out complementary to a large number of people, we depend on our sales to do so. Now, if you have the proper qualifications we would be glad to send you one, we even pay for the shipping. Go to our site, and send a request through the comment section, and include your qualifications. Researcher, professor, and etc. Of course a Ph.D. always helps.
http://www.thehillsgroup.org/
Davy on Wed, 23rd Jul 2014 1:20 pm
M, looks like you got Wak’d.
marmico on Wed, 23rd Jul 2014 2:29 pm
No need for a snailmail complementary to view your 57 page magnus opus report, shortonoil.
You are on record that annual world petroleum infrastructure is about $13-15 trillion, round it to 80% of U.S. GDP. Now the Platts, IHS Globals, etc. of the world say that upstream oil and gas E&P is $1 trillion (about $200 billion in the U.S.). That’s a momentous amount of midstream and downstream stuff to make up the difference, don’t you think. Are you sure you didn’t sneak in an extra zero in your model? LOL
Keep selling that opus BS to grade schoolers.
J-Gav on Wed, 23rd Jul 2014 3:14 pm
Marmico – Thanks for the comic relief (from reality). You trolls have a role to play after all …
Just one short reaction – blaming the elderly for the rise in health-care costs is like blaming the wounded women and children of Gaza for the shortage of hospitals and medications there. Take a peek at what Big Pharma actually does to make sure health costs DON’T go down before blithering such nonsense.
Here in Europe health-care is also far from perfect, there is corrupt collusion between big drug companies and doctors for ex, but, in France, again for ex, it costs less than HALF what it does in the States! An MRI in the US costs around $1000. It’s $300 in France.
Can your pea-sized brain figure out that there’s a little problem there?
marmico on Wed, 23rd Jul 2014 5:02 pm
I’m happy to be a troll amongst the circle jerkers who retire to their doomsteads after chopping a chord of moisture laden wood and then ruminate over the net about their preparation H cream.
I trolled out that health care, not gasoline, is the concern for U.S. residents.
This site is way too complicated to register. This is for Pops. The indexed gasoline consumption from the BEA Income and Outlays Table 2.3.5 not the S&P500 GSCI Gasoline Index. Big difference, eh!
Davy on Wed, 23rd Jul 2014 5:30 pm
M, there are those who are deluded by numbers and their desire to prove others wrong at the expense of the common effort to find truth. You are exhibiting examples of the psychopaths on wall street who are driven by competition to win at all cost. Greed is the creed and winning is everything. Wall street has promoted this way of life for 30 years. I am talking a new normal today of taking no prisoners. Greed and competition has always been part of the game but there were checks and balances, rule of law, and simple societal norms. If we have been mean to you here it is because you lack manners, respect, and compassion. Many of us here meet through this forum on a regular basis. We are digital friends attempting to make sense out of something that is quite complex and dangerous. We are talking about the survival of mankind. We are not on the Jeopardy show with a prize at the end. Why don’t you try to contribute in a positive manner to help us in this journey instead of playing the “junk yard dog”
marmico on Wed, 23rd Jul 2014 6:51 pm
Truth. You can’t handle the truth, Davy. Nonetheless, I respect your balanced approach to engage in bicameralism. However, I have neither the time nor the inclination to set you free of your digital Code Red Malthusianism.
In my life journey I know and respond, sometimes inappropriately, to bullshit when I read it.
Okay, so who is taking bets with the junk yard dog on the following:
Annual U.S. C+C production as measured by the EIA will be higher in either 2016 or 2017 than in 1970.
Northwest Resident on Wed, 23rd Jul 2014 7:35 pm
Bicameralism is an essential and defining feature of the classical notion of mixed government. Bicameral legislatures usually require a concurrent majority to pass legislation.
Yeah, that’s what Davy was doing — engaging in bicameralism. Bet you didn’t know that, did you Davy?
I have to hand it to you marmico. For a minute there I thought you were just another Class A asshole and an abject asshole out to prove to himself that he’s smarter than everybody else, needing to do so because that particular personality type tends to be a total failure at everything resulting in a deep-seated need to prove to anybody who will listen that he is NOT in fact the Class A asshole and abject dumbass that everybody knows he is. But hey, if you can use a world like bicameralism then it must be that you’re a friggin genius after all.
Lay some more big words on us, marmico. Prove to us that you’re not the Class A asshole and abject dumbass that you so clearly appear to be.
marmico on Wed, 23rd Jul 2014 7:58 pm
Bicameral is a divided house, dipshit.
Northwest Resident on Wed, 23rd Jul 2014 8:46 pm
The American Heritage® Dictionary
bicameralism
a legislative body having two branches, houses, or chambers
marmico, you prove yourself to be the ultimate dumbass, again. Throwing around big words to impress people is one thing, not knowing what the big word that you’re throwing around means is a sign of pure idiot.
But hey, the jury isn’t in yet. You still have time to dig yourself out of the sewage pit you belly flopped into. Lay another big, impressive, smart-sounding word on us, marmico. Come on troll boy — prove you’re a real man. Squeeze another big one out of that mushy brain of yours.