Peak Oil is You

Donate Bitcoins ;-) or Paypal :-)
Page added on November 22, 2014
Bakken Sweet Spots are Petering Out

The Bakken, as well as other shale oil areas, is not one homogeneous area where equal amounts of can be found. David Hughes in DRILLING DEEPER puts it this way, though here he is talking about gas wells, the same applies to oil wells:
All shale gas plays invariably have “core” areas or “sweet spots”, where individual well production is highest and hence the economics are best. Sweet spots are targeted and drilled off early in a play’s lifecycle, leaving lesser quality rock to be drilled as the play matures (requiring higher gas prices to be economic); thus the number of wells required to offset field decline inevitably increases with time.
However the Bakken, at least through the September North Dakota Industrial Commission production report, has given no real indication that the Bakken is even close to peaking. But a closer look at the data makes me believe that is all about to change.
The NDIC issues a Daily Activity Report where they list permits issued as well as wells completed and wells released from the tight hole confidential list. These reports usually, but not always, also give the number of barrels of oil per day and barrels of water per day for the first 24 hours of production. I have gone through every day, back to November 1st, 2013 and collected the data on every well listed that gives production numbers and copied that data to Excel. In that one year and three weeks I have gathered the data form every one of the 2,171 wells that give production numbers. Sorting these wells by well number, which is the original permit number, gives some startling results.
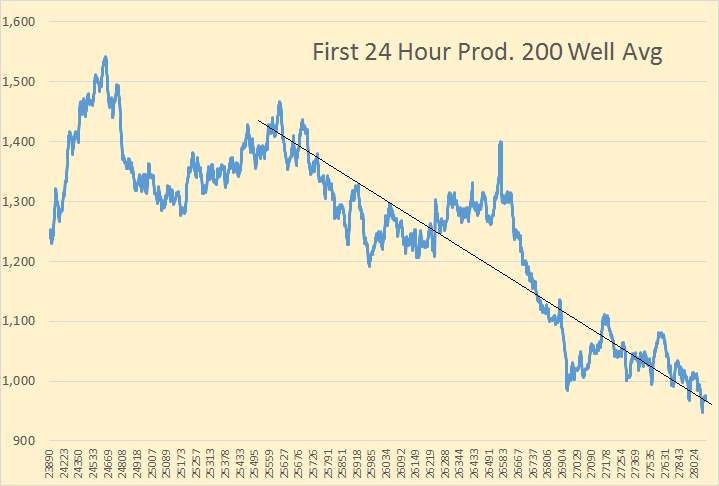
To smooth the chart I created a 200 well average of barrels per day per well. The first point on the chart is therefore the average to the 200th well, #23890 and the last point is the 200 well average to the 2171st well, #28971. As you can see there has been a continuous, though erratic, decline in first 24 hour production as the well numbers increase.
Breaking this down according to well numbers we see production peaked with the 2400s and have steady decline since. Every group of well numbers do not contain the same number of wells.
Well Numbers BOPD Number of Wells in Sample
18s – 22s 1,235 81
23000s 1,362 134
24000s 1,497 285
25000s 1,320 676
26000s 1,198 591
27000s 1,016 361
28000s 841 40
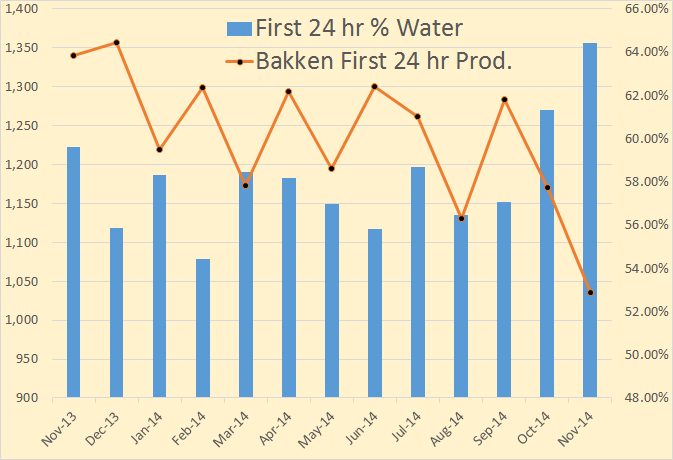
The above chart is monthly first 24 hour production per well and first 24 hour percent water per well of all wells that the NDIC listed production numbers. The November 2014 numbers are only through November 21st.
Note: The first 24 hours of production is far from being the average first years production. And though all wells are different I am relatively sure there is an average conversion rate but I have no idea what it is. I would guess it is somewhere between one quarter to one third of the first 24 hours of production. But if anyone has any idea what the average conversion factor is, if one exists, please email me at DarwinianOne at Gmail.com, or post it in the comments section of this post.
North Dakota issues drilling permits in sequential order. But those permits are not drilled in sequence. Drillers will often sit on a permit for two to three years, renewing then as the law requires.
A list of all active drilling rigs, the well number they are working on and the date they started can be found at the NDIC’s Current Active Drilling Rig List They are listed according to their API number but the list can be copied and pasted into Excel and sorted according to your wishes.
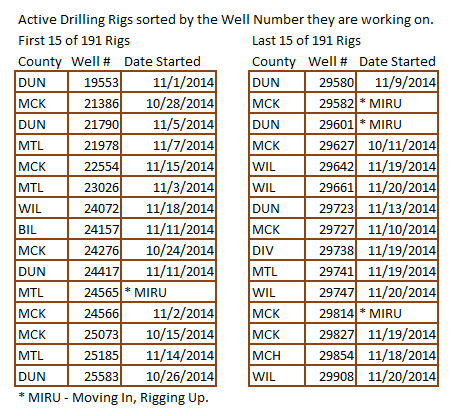
Of the 191 rigs working, 39 or 20% are working well numbers below 28000. 76 or 40% of rigs are working well numbers in the 28000s. And 76 or 40% are working well numbers in the 29000s. Permit #28000 was issued on March 26. 2014. So 80% of all rigs are working on recently issued permits.
As of November 21st, the highest well number completed was #28971. The highest number well currently being drilled is #29908. The highest permit number issued is #30076.
Will enhanced oil recovery keep the Bakken going into the future. A simple one word answer is “no”, as this article explains.
Enhanced oil recovery techniques limited in shale
Energy companies currently leave about 95 percent of the crude in the ground at today’s unconventional oil wells, but they face major technological challenges in boosting recovery rates, a Schlumberger scientist said Tuesday…
“Our entire spectrum of secondary recovery methods don’t work,” Kleinberg said, in a sobering talk at the Energy Information Administration’s annual summit in the nation’s capital.
Water flooding — where water can be swept from separate injection and producer wells — isn’t an option because the tight oil formations are too dense to permit those water flows.
And while carbon dioxide can be used to pressure up a conventional oil well, there’s currently a limit on the amount of that gas that is available to pump underground. “The oil industry would like to have more CO2, which is a great way to get more oil out of the ground, but there are limits on affordable, accessible supplies of CO2,” Kleinberg said, quipping: “The oil industry lives in a CO2 constrained world; it is only the oil industry that thinks there is not enough carbon dioxide.”
In conclusion, first 24 hour production per well, when measured by well number, has dropped by 40 percent since peaking in the 24000s. This, to me anyway, clearly indicates that the sweet spots are playing out and companies are now drilling on less productive acreage. I now believe that North Dakota production will peak no later than 2015 with a high probability that 2014 will prove to be the peak year.
22 Comments on "Bakken Sweet Spots are Petering Out"
Nony on Sat, 22nd Nov 2014 4:06 pm
1. It’s a nice try at an analysis. Kudos for doing something new.
2. Plotting with non zero axes make the trend look much more meaningful than it is. Can lead to mistakes (have seen Ron do this before, for example with Russia dropping a bit over a few months and thinking they were in decline because he graphs with non zero).
3. I wonder if the same analysis, with all the caveats (low sample, permits versus dates, etc.) had shown an INCREASE in output if Ron would have touted the results as meaning the Bakken was taking off? [I think he has a peaker bias.]
4. In addition to all the caveats, DC had, you have to consider the issue of confidential wells (a very large portion). If conf wells are biased high, then looking at recent well IPs will bias the sample. (conf wells don’t give their IP test for 6 months or so.)
5. In essence, I think the killer analysis is the Enno cum curves. Ron has had those on his site for months so not sure why he would run with something like this. It sort of reminds me of when he was saying Texas was in decline because of RRC data, where he thought only the first month was a significant correction (I think he learned his lesson there although he never really faced the music.)
rockman on Sat, 22nd Nov 2014 5:10 pm
“The first 24 hours of production is far from being the average first years production. And though all wells are different I am relatively sure there is an average conversion rate but I have no idea what it is. I would guess it is somewhere between one quarter to one third of the first 24 hours of production.” Very nice data gathering. But I suspect you won’t like hearing my answer. First, I drill in Texas and La but I suspect procedures aren’t much different in the Bakken.
So I drill, complete and test a well in Texas. Conventional or frac’d unconventional…doesn’t matter. A simple but common example: the oil flows out of the well head. Within the head is the assembly that holds the “choke”. The choke is a small plate with a hole thru which all the oil flows. The chokes are designated by the diameter of that hole expressed in inches: an 8/64″ choke, a 12/64″ choke, etc. Yes: might be difficult to imagine but wells with flow rates of 1,000 bbls (42,000 gallons) of oil per day might be flowing thru a hole less than 1/4″ diameter.
Now I test the well by flowing it for maybe several hours thru different chokes. Maybe 900 bopd thru a 14/64″ choke. And then 750 bopd thru a 12/64″ choke. And then 500 bopd thru an 8/64″ choke. And in addition to those rate changes the flowing pressure changes with choke changes. I flow it thru different chokes because the variations help me to better understand the completion quality.
Now what rate do I report that the well testing at: 900 bopd,750 bopd, 500 bopd? I can report any one of those numbers I choose. There is no public reporting standard required by the Texas Rail Road Commission. The state does get all the engineering details and the are available to the public: all you have to do is go find them in the massive data base.
So here’s a simple question: how many times have you seen someone post an oil flow rate AND included the choke size and the flowing pressure? There’s a huge difference between two wells flowing 700 bopd if one is on a 16/64″ choke and the other on an 8/64″ choke…a hole half the diameter.
If that’s not bad enough I can flow a well on a 12/64″ choke at 900 bopd and see that rate slowly drop or increase. I can stop the test at anytime and report a rate that hasn’t stabilized.
You want more complications? It’s not uncommon to let a frac’d well (hz or very) flow at a lower initial rate for weeks: you don’t want to “pull the well too hard” initially for fear of damaging the frac job.
Now here’s the real killer: the initial flow rate of a well in a pressure depletion drive reservoir, as all the shale plays are, has no implication of how much it will be flowing in 12 months. I can test two EFS wells at 900 bopd…same choke and same pressure. And 12 months later one is producing 600 bopd and the other 100 bopd. The rates will be determined by the volume of the reservoir being drained. Simple analogy: you have two steel tanks with one containing 20,000 gallons of water and the other 50,000 gallons. Both are at 9,000 psi. You punch a 12/64″ hole in each tank and they shoot out water at the same rate. But as time passes the pressure in both tanks declines and thus the flow rate decreases in the smaller tank faster. That rate decreases faster in the smaller tank faster because the pressure decreases faster. I’ll skip the physics but this is part of the science behind hyperbolic decline.
Essentially ever EFS well at the same depth has roughly the same reservoir pressure. But how quickly that pressure (and flow) declines will depend upon the volume of the pore spaces being drained. Which is why there are EFS wells that initially produced at 500+ bopd with some ultimately producing 300,000+ bbls and others less than 100,000 bbls.
And if that isn’t confusing enough there are a variety of logistical issues that can prevent a well from flowing at the higher it might be producing several months later. After 3 or 4 years of producing an EFS you can make a pretty good guess of the URR. But doing so during the first few months (let alone from the initial tent rate) of production? Not so much. LOL.
shortonoil on Sat, 22nd Nov 2014 5:14 pm
With well depth running 11,200 feet in McKenzie county a 64% water cut is going to be an early death call for these wells. The lifting costs will bring on early shut-ins. For a conventional 4,000 foot well, a water cut of 97.8% (WOR 45:1) usually brings on well closure because the lifting costs exceeds the value of the oil. In an 11,200 foot well it will be much lower.
also:
Ron is presenting histograms, the most common form of data presentation. They are not data plots so they have no zero coordinate. There is no mathematical equation associated with them. Just thought I’d mention that! Nice work as usual.
Nony on Sat, 22nd Nov 2014 5:23 pm
The water cut gets worse as you move from the center of the play (get less deep). So not sure why the worry about McKenzie county.
I wonder how much of the water cut issue is from moving out, moving to the TF, pumping MORE WATER IN, interference/downspacing, etc. Definitely an interesting issue.
Water is a pain in the butt, sure, but I don’t think 64% is anything particularly onerous, no?
Plantagenet on Sat, 22nd Nov 2014 5:40 pm
The Bakken is a TIGHT shale, not a conventional oil field in a porous reservoir rock. There is no “water cut” in tight shales because there is virtually no porosity or permeability except for the cracks created by the frack job. The water that is coming up the hold in the first 24 hours of flow is the very same water that was put down the hole during the frack job.
With longer holes, bigger frack jobs, and more water injected for fracking, its not surprising that more water is coming up the hole on the first day—more water in means more water out.
Makati1 on Sat, 22nd Nov 2014 7:26 pm
Anyway you slice it, the US is never going to be the oil engine it once was. Not even close. But the government wants you and the world to believe it will. That BS only fools the suckers and uneducated who still believe that America is the land of milk and honey and still #1. An increasingly declining number of people.
Boat on Sat, 22nd Nov 2014 7:39 pm
America was never the land milk and honey. Here you got to bust your butt to make a decent living. Work long hrs and be smarter than most of the folks around you.
Makati1, for someone who claims to have lived here for decades you sound like a foreigner who thinks they have read enough to know. You don’t have a clue.
Ron Patterson on Sat, 22nd Nov 2014 7:53 pm
Plantagenet wrote:
“There is no “water cut” in tight shales because there is virtually no porosity or permeability except for the cracks created by the frack job.”
Plant, I have always suspected that you had no idea what you were talking about. Now my suspicions are confirmed. Go here:
https://www.dmr.nd.gov/oilgas/mpr/2014_09.pdf NDIC Oil and Gas Production Report.
You will see that many months after the initial production almost all wells are producing a lot of water, some far more water than oil.
Plantagenet on Sat, 22nd Nov 2014 8:09 pm
Ron: I have always suspected that you had no idea what you were talking about. Now my suspicions are confirmed.
Everyone knows that hydraulic tracking requires millions of barrels of water. But perhaps you don’t know that a good part of that water comes back up the hole. Collecting and disposing of that water is a big problem in hydraulic fracking because it leaches out nasty things like radioactive elements.
Yes, there is some additional water in the tight shales along with the oil. But this is not the same as a “water cut” in an conventional oil field. IN a conventional field the oil is often floating on water within the reservoir. An increasing “water cut” indicates the oil/water contract is rising as the oil is produced. Thus a rising water cut is a sign that the oil reservoir at the top is being depleted.
In a tight shale, there is no similar significance to the “water cut” There is some water trapped in the shale along with oil, and it will be produced with the oil long after the tracking fluids are recovered. But the amount of water will not change as the reservoir is depleted due to a rising oil/water contact because there is no oil/water contract in a tight shale.
Get it now?
coffeeguyzz on Sat, 22nd Nov 2014 9:40 pm
Should anyone reading this want to get a ‘real time’ sense of how the Bakken sweet spots have not yet BEGUN to be tapped out, one can spend about 5 minutes (I just did it in two), and pull up slide/page 13 from the North Dakota’s DMR August release “Spotlight on the Bakken”. (This 31 page report is chock full of relevant, easy-to-read data). See all those short, white lines indicating 60 day IPs of over 1,000 barrels/day? That is the Parshall field, mostly HBP by EOG.
Now, hit the Gis button from the DMR site and zoom in till the individual wells are visible to see how few wells have been drilled there. (BTW, every well drilled in North Dakota since the early 50’s is accessible this way).
One should be immediately struck by how FEW wells have been drilled in this absolute sweetest of sweet spots in all of the Bakken – especially in sharp contrast to the nearby Sanish field – also highly productive.
Every pair of the ‘rectangles’ on the Gis map will ultimately host upwards of 30 wells if the recent, highly effective completion techniques are applied here … as EOG will most assuredly do.
The comment Mr. Patterson made regarding the non-viability of EOR in all the shales – not just the Bakken – will be disproven way sooner rather than later as the laboratory results from the University of North Dakota’s EERC group, or its many peers, is applied in the field.
To this end, GE is investing an ADDITIONAL $10 billion in worldwide collaboration with the likes of Statoil and other operators to greatly enhance the ability to more fully extract hydrocarbons everywhere.
Ron Patterson on Sat, 22nd Nov 2014 9:48 pm
No, you are the one that don’t get it. And you are trying to weasel out of what you originally claimed.
Plant said: “There is no “water cut” in tight shales because there is virtually no porosity or permeability except for the cracks created by the frack job.”
There is water cut and that is exactly what they call it in North Dakota. No one said the water had to increase as water rose in the reservoir.
You can find the definition of “water cut” dozens of places on the net. Here is just one of them.
http://www.enggcyclopedia.com/2012/02/water-cut/
Water Cut
Water cut for crude oil refers to the mass percentage of water in all the liquids, i.e. crude oil plus water. Water cut is an important parameter along with the ‘Gas to Oil Ratio’ (GOR) of a crude oil to clearly indicate the water content in reservoir fluids.
Water cut can be expressed using following equation,
Water cut = Mass of water in a sample X 100 / (mass of water + mass of oil in the same sample)
Notice it doesn’t say anything about rising or falling water cut. It is just the percentage of water in the oil.
Got that?
Ron Patterson on Sat, 22nd Nov 2014 9:59 pm
Plant, you are just trying to weasel out of your silly mistake. You said:
“The Bakken is a TIGHT shale, not a conventional oil field in a porous reservoir rock. There is no “water cut” in tight shales because there is virtually no porosity or permeability except for the cracks created by the frack job.”
That is just plain wrong. Water cut has nothing to do with rising or falling water, water cut is just the percentage of water in the oil. That is all.
http://www.enggcyclopedia.com/2012/02/water-cut/
Water Cut
Print Friendly
Water cut for crude oil refers to the mass percentage of water in all the liquids, i.e. crude oil plus water. Water cut is an important parameter along with the ‘Gas to Oil Ratio’ (GOR) of a crude oil to clearly indicate the water content in reservoir fluids.
Water cut can be expressed using following equation,
Water cut = Mass of water in a sample X 100 / (mass of water + mass of oil in the same sample)
Got it.
coffeeguyzz on Sat, 22nd Nov 2014 10:12 pm
Rockman, regarding choke size and IPs … the monster well that MHR unveiled in the Utica dry gas area in West Virginia had a 32/64″ choke with 7,810 psi flowing casing pressure, (shut in pressure was 9,050 psi) and a 24 hr flow rate of 46.5 MMcf/day. The Utica will make the Marcellus look like its little brother.
Makati1 on Sun, 23rd Nov 2014 12:04 am
Boat, the America I grew up in (50s-60s was close to the propaganda picture the government likes to paint for the world through movies and TV. It hasn’t been like that for decades.
My dad made a decent living working 40 hours per week making patterns for a local steel foundry and my mom stayed home and raised us kids. We had a new car, summer vacation to the beach for a week, 21 inch TV (Sylvania w/halo light) when I was 6 (1950) and nice bikes and toys. We didn’t lock our doors when we went out or worry about toys left on the lawn. It was a safe, beautiful country … then. Maybe you never experienced that America. I did.
Today’s America is approaching 3rd world levels fast. Only one more relapse of the US economy to make it permanent.
Nony on Sun, 23rd Nov 2014 12:10 am
Is there a textbook or journal article that shows the benefits in terms of EUR from choking down? I had the impression this was just sort of suspicion but not proved. Was under the impression that the benefit of choking was more related to delaying artificial lift.
Coffee: give it a rest with the Utica. Point Pleasant/Huron/Utica is a great formation, but Marcellus is the big daddy. Utica is too deep to have as good economics. It’s drilling productivity is half that of the Mighty Marcellus.
http://www.eia.gov/petroleum/drilling/
Nony on Sun, 23rd Nov 2014 12:21 am
coffee:
Here’s an excellent presentation on Utica. Chock full of analysis. Unfortunately does not address the Shell well area as that was so recent. But still, lot of very good content and perspective.
http://extension.psu.edu/natural-resources/natural-gas/webinars/utica-and-point-pleasant-where-are-we-now
Dsr on Sun, 23rd Nov 2014 9:01 am
Plantaganet. You mention shale having ‘virtually no porosity’. This is extremely wrong. Shale has extremely high porosity, usually the highest of all formations. Its the zero perm that keeps it locked up.
coffeeguyzz on Sun, 23rd Nov 2014 10:34 am
Nony, as the second biggest booster on this site of The Mighty Marcellus, I thank you for the links … BUT I feel the webinar info actually validates my contention that the dry gas area of the Utica will eventually surpass the Marcellus in output.
All but a few wells used in the PSU analysis were in the wet gas/oily window in Ohio or W.VA. I downloaded the accompanying 39 page pdf so as to better understand and study it and the author clearly states the easterly areas are mostly unknown. Well, as his data is from production a year or more old and NOT including dry gas PA acreage, of course he cannot incorporate the recent wells hundreds of miles east as well as the 40MMcfd wells to the south.
I will continue to go over this – and related info – but until now the Utica’s action has been almost exclusively focused on the shallower, wetter areas to the west. As more ‘big boy drilling’ (to use Hamm’s colorful phrase) in the 12,000 foot plus deep easterly sections occurs, the Ute’s 500 to 900 foot thick payzones – coupled with the staggering overpressure – will manifest.
The infrastructure buildout with both gathering/take away/processing facilities will ensure massive gas production from BOTH formations far into the future.
Davy on Sun, 23rd Nov 2014 10:50 am
Java guzzler, I am very excited by the eastern dry gas plays you and NOo are promoting on this board. I feel it may enhance the reliance and sustainability of US BAU efforts in the coming descent. We need a gentle degree and duration of this contraction process. I am wondering if financially these plays can be maintained in the coming decent or will they be nationalized by virtue of national security?
Nony on Sun, 23rd Nov 2014 11:00 am
cg:
There’s also the WV MHR Utica well. You should throw that in my face too. Utica definitely is getting bigger.
ITG had Marcellus “peaking”* at 25 (currently is 16). And Utica “peaking”* at 7 (currently is 1.5). If you say, triple the Utica based on WV and NE PA, you still are 21 and short of the Marcellus.
Also, I think the gas game may come down to one of price competition. And the Marcellus is just shallower and has higher productivity per rig.
*Not actually peaking, that’s just the end of their prediction, but they show continuing growth for both although slowing.
Nony on Sun, 23rd Nov 2014 11:03 am
Davy, keep hanging with us jock cornies. Leave the punk arty goth doomers behind. You could have your own ‘vette with a sweetheart Carolina gal hugging you. 😉
Plantagenet on Sun, 23rd Nov 2014 3:45 pm
Far. The porosity of shales is inversely proportional to density. You can’t assign a single value to shale porosity. And even when there is a signicant level of shale porosity, it’s not high enough to create passageways for oil to move through the shale, hence the low permeability and the need to frack the shale to extract the oil.