Desmond Smith posted a comment after my previous blog: “The crash in the price of oil may change the oil market – a look at the IEA’s “Oil Medium-Term Market Report 2015” and it requires a lengthy response. Therefore, I am giving it in this separate blog.
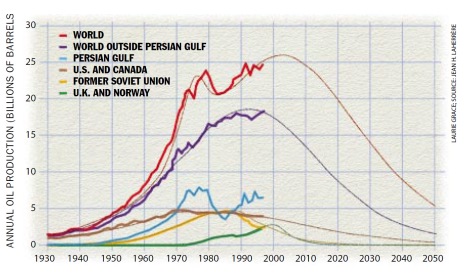
17 years ago, in March 1998, Colin Campbell and Jean Laherrère published their now classic article, “The End of Cheap Oil” in the journal Scientific American. The figure above is copied from the 1998 article and shows curves fitted to oil production with the source of this information given as Jean Laherrère.
It has been quite a long time since I read Colin and Jean’s article but after a comment by Desmond Smith below my blog, “The crash in the price of oil may change the oil market – a look at the IEA’s “Oil Medium-Term Market Report 2015”, I have now re-read it.
Desmond objected to my statement that, “We can see now that Colin and Jean’s 1998 predictions have proven completely correct.” He commented:
“No, definitely not. I have the 1998 predictions in front of me now. On page 81 there is a chart showing all oil (including unconventional) beginning a terminal decline around 2004-2005. By now, the supply of all oil (including unconventional) was supposed to have declined absolutely by about 14% relative to 2004, and still declining. That has not happened.”
I was surprised because Jean has always said that the scenario concerned conventional oil (crude oil). In the article, Colin and Jean discuss only crude oil. However, confusion arises when examining the blue explanatory text to the left of the figure in the paper:
“GLOBAL PRODUCTION OF OIL both conventional and unconventional (red), recovered after falling in 1973 and 1979. But a more permanent decline is less than 10 years away, according to the authors’ model, based in part on multiple Hubbert curves (lighter lines). U.S. and Canadian oil (brown) topped out in 1972; production in the former Soviet Union (yellow) has fallen 45 percent since 1987. A crest in the oil produced outside the Persian Gulf region (purple) now appears imminent.”
When reading other comments in blue text in the article it is obvious that those were written by a Scientific American editor and I suspect this is also the case for the blue explanatory text next to this figure. Since Colin and Jean do not describe any calculations of unconventional oil I began to suspect that the word “unconventional” had been inserted erroneously. So I wrote an email to Jean to sort out the situation. Here is his reply:
Dear Kjell
In the joint 1998 article we were rather shy on defining unconventional. At this time and even now there is no consensus on what is conventional or not. For me conventional was primary and secondary recovery production where only pressure was changed with water or gas injection. My 1998 red curve is crude oil less extra-heavy which for me is conventional.
Jean
Thus Jean has confirmed that the word “unconventional” in the blue text is inappropriate and that the phrase “both conventional and unconventional” should have read only “conventional”. At this current, critical phase in the history of global Peak Oil I feel it is very important to correct this error in the text of the 1998 article.
To Desmond Smith I would say that his comment was correct. His criticism would be completely justified if the curves in the 1998 figure did actually depict conventional plus unconventional oil. I hope that all readers of this blog will take the opportunity to read Colin and Jean’s article to see how insertion of the word “unconventional” is clearly in error. I thank Desmond for the opportunity that his comment gave me to correct an error of 17 years standing.
Regarding their method of “Predicting the Inevitable” in the 1998 paper Colin and Jean write:
“Predicting the Inevitable Predicting when oil production will stop rising is relatively straightforward once one has a good estimate of how much oil there is left to produce.”
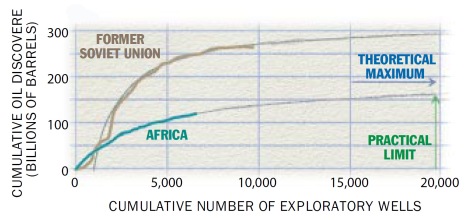
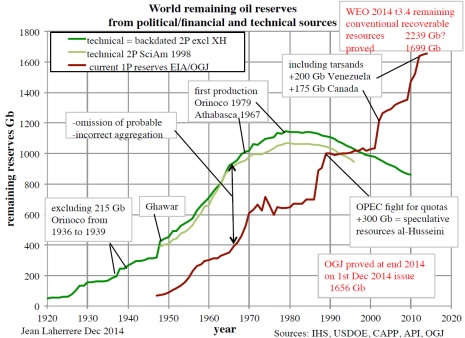
In this part of the article Jean introduces what are today called “creaming curves”. In the article there is a figure featuring creaming curves for “Africa and the Former Soviet Union”. The figure shows the cumulative amount of discovered oil as a function of the number of wells drilled to find that oil, “wildcats”. To make such a graph one must have access to detailed data. Jean and Colin had such access because they were consultants for the firm Petroconsultants in Geneva. The figure shows that smaller oilfields were being found as the number of wells drilled increased. By extrapolation, Colin and Jean estimated how much more crude oil would be found in various geographical regions in the future. It was these values that they used to estimate the time-point of maximal crude oil production (peak conventional oil). When Jean answered my email inquiry regarding the text in the 1998 Scientific American article, he also sent me an updated version of a figure in the paper.
The light green curve represents the values used in 1998 and the dark green is Jean’s revised curve. Colin and Jean down-corrected the extremely high upward reserve revisions that Saudi Arabia made during the 1980s but we know now that the world’s largest conventional oilfield, Ghawar, is larger than they then believed. Another important revision in oil accounting that Colin and Jean introduced in their paper was called “backdating”. This was to correct for the common practice by oil companies of regarding revisions to the estimated recoverable reserves in old oilfields as new discoveries of oil in the year that the revision is made. Backdating corrects this by translating revisions in estimates of recoverable oil from oilfields back to the original date of oilfield discovery (since the oil was there all along, it is only oil companies’ awareness of it that changed). Without backdating one sees the red curve rather than the dark green one and the impression given of discoveries of oil is entirely different. We can see that new backdating that includes revisions made since 1998 increases the peak of oil reserves by 80 billion barrels. This additional oil amounts to a little less than three years of world oil consumption. If it had been accounted for in 1998 then the estimated date of the peak of world oil production would have shifted from 2003 to 2005.
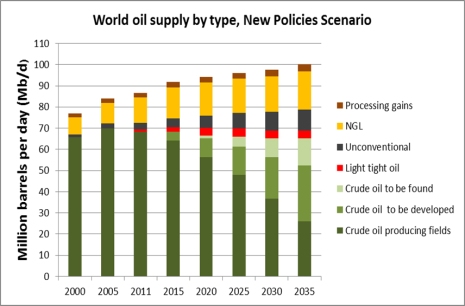
In Jean’s figure, production is given in billions of barrels per year and when we express this as production per day we obtain the following values: 2000 – 70.7 Mb/d, 2003 – 71.5 Mb/d, 2005 – 71.0 Mb/d, 2010 – 67.5 Mb/d, 2015 62.5 Mb/d and 2020 – 54.8 Mb/d. In the figure above you can see that the IEA gave the maximum of “crude oil” production as 70.0 Mb/d in 2005. Jean and Colin had predicted maximal production of 71.5 Mb/d in 2003. In 2011 the IEA stated production at 69.9 Mb/d while Jean and Colin had predicted a production rate of 66. 8 Mb/d. The increase in reserves that Jean showed in his revised figure has the effect that the decline in production rate after the peak of oil production is not as rapid as predicted in the 1998 article. Another important point to note is that if one uses the Hubbert method for estimating Peak Oil then the estimated peak is commonly higher than occurs in reality and the predicted decline is usually faster than actually seen. This is what Jean’s revised figure shows. However, I think it is still justified to state that, “We can see now that Colin and Jean’s 1998 predictions have proven completely correct.” That a prognosis made 17 years ago could come so near to describing future reality is truly remarkable.
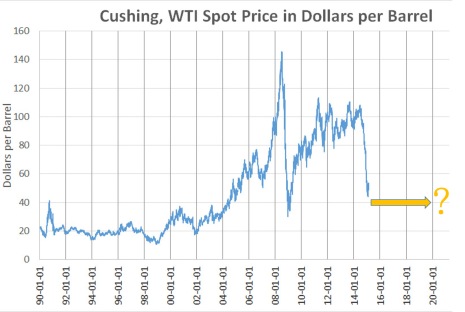
Regarding the assertion that cheap oil would run out in 2003 one can see that during the 1990s we experienced an oil price that even dropped below $20 per barrel. However, after 2002 the price began to rise markedly and it was, indeed, the end of cheap oil. Although the oil price is currently around $50 per barrel it is still relatively expensive compared to the price during the 1990s. Some are now arguing that the price will be $40 for an extended period.
In their 1998 article Colin and Jean did also discuss unconventional oil. They wrote:
“Last, economists like to point out that the world contains enormous caches of unconventional oil that can substitute for crude oil as soon as the price rises high enough to make them profitable. There is no question that the resources are ample: the Orinoco oil belt in Venezuela has been assessed to contain a staggering 1.2 trillion barrels of the sludge known as heavy oil. Tar sands and shale deposits in Canada and the former Soviet Union may contain the equivalent of more than 300 billion barrels of oil [see “Mining for Oil,” by Richard L. George, on page 84]. Theoretically, these unconventional oil reserves could quench the world’s thirst for liquid fuels as conventional oil passes its prime. But the industry will be hard-pressed for the time and money needed to ramp up production of unconventional oil quickly enough
Such substitutes for crude oil might also exact a high environmental price. Tar sands typically emerge from strip mines. Extracting oil from these sands and shales creates air pollution. The Orinoco sludge contains heavy metals and sulfur that must be removed. So governments may restrict these industries from growing as fast as they could. In view of these potential obstacles, our skeptical estimate is that only 700 Gbo will be produced from unconventional reserves over the next 60 years.”
Finally, regarding the price of oil, Colin and Jean wrote:
“The switch from growth to decline in (crude) oil production will thus almost certainly create economic and political tension. Unless alternatives to crude oil quickly prove themselves, the market share of the OPEC states in the Middle East will rise rapidly. Within two years, these nations’ share of the global oil business will pass 30 percent, nearing the level reached during the oil-price shocks of the 1970s. By 2010 their share will quite probably hit 50 percent.
The world could thus see radical increases in oil prices. That alone might be sufficient to curb demand, flattening production for perhaps 10 years. (Demand fell more than 10 percent after the 1979 shock and took 17 years to recover.) But by 2010 or so, many Middle Eastern nations will themselves be past the midpoint. World production will then have to fall.
With sufficient preparation, however, the transition to the post-oil economy need not be traumatic. If advanced methods of producing liquid fuels from natural gas can be made profitable and scaled up quickly, gas could become the next source of transportation fuel [see “Liquid Fuels from Natural Gas,” by Safaa A. Fouda, on page 92]. Safer nuclear power, cheaper renewable energy, and oil conservation programs could all help postpone the inevitable decline of conventional oil.”
Fracking is delaying the moment when global production of liquid fuels begins to decline. In 1998, Colin and Jean gave the peak of all liquid fuels as 2010 but, at the same time, noted that some responses could delay this date. The most important lesson that we can now take from the 1998 article was that the world was warned that the days of inexpensive oil were numbered and that many nations that import large quantities of oil, not least those of the EU, should have listened to this advice and responded more appropriately.


yogi on Fri, 27th Feb 2015 2:27 am
If you’ve got an EROI of 1.1:1, you can pump the oil out of the ground and look at it. If you’ve got 1.2:1, you can refine it and look at it. At 1.3:1, you can move it to where you want it and look at it. We looked at the minimum EROI you need to drive a truck, and you need at least 3:1 at the wellhead. Now, if you want to put anything in the truck, like grain, you need to have an EROI of 5:1. And that includes the depreciation for the truck. But if you want to include the depreciation for the truck driver and the oil worker and the farmer, then you’ve got to support the families. And then you need an EROI of 7:1. And if you want education, you need 8:1 or 9:1. And if you want health care, you need 10:1 or 11:1.
If you look at the bottom of the EROI ratio list, you will see that our modern Food Production-Processing-Distribution system has a 1/10 EROI. This means, for every 10 energy calories of energy consumed in this process, we put 1 calorie of food on the dinner table.
jm on Fri, 27th Feb 2015 3:50 am
this writer perhaps suffers from schizophrenia.
yoananda on Fri, 27th Feb 2015 5:20 am
“Fracking is delaying the moment when global production of liquid fuels begins to decline”
Yes, but it’s not delaying global BTU avaiable and global gazoline.
So … do we really care about the number of barrel producted without looking at what’s inside those barrels ?
Davy on Fri, 27th Feb 2015 5:29 am
yogi-MAN, great eroi picture for my mind to chew on!!
Aire on Fri, 27th Feb 2015 6:22 am
Please comment on this Plant. We need your expertise.
Although there are some minor issues with the original report this pretty much sum it up. “However, I think it is still justified to state that, “We can see now that Colin and Jean’s 1998 predictions have proven completely correct.”
“Although the oil price is currently around $50 per barrel it is still relatively expensive compared to the price during the 1990s”
And who knows how long these prices will last.
Revi on Fri, 27th Feb 2015 7:15 am
Prices may not go up, because the world can’t afford more expensive oil. We are at a point where we can’t afford the world we are living in, but don’t know it yet.
marmico on Fri, 27th Feb 2015 7:21 am
2014 global oil production was ~28 Gb less Athabasca and Orinoco extra heavy of ~2 Gb or ~26 Gb.
In 1998, Campbell/Laherrère estimated 2014 production of ~22.5 Gb ex-extra heavy.
Where did they principally go wrong? Former Soviet Union going to zero and the U.S. light tight oil bonanza.
JuanP on Fri, 27th Feb 2015 9:26 am
You can’t do much better than Colin Campbell, Jean Laherrere, and Kjell Aleklett where Peak Oil analysis is concerned. I couldn’t thank these guys enough for what I’ve learned from them.
Unfortunately, some people will never accept reality. My father was like that, he lived all his life denying reality and the truth, and died in total denial. It was a sad and infuriating thing to watch growing up, I was always ashamed of him when I was young, he led a complete waste of a life. My brother and I weren’t there when he died, we said our goodbyes a year earlier. I never was a good son, myself.
Northwest Resident on Fri, 27th Feb 2015 9:31 am
“the U.S. light tight oil bonanza”
Financed by mountains of unpayable debt amounting to hundreds of billions.
Enabled by ZIRP, which chased conservative investors out of “safe” investments and into the waiting jaws of higher yielding junk bonds, the primary mechanism for financing the “shale revolution”.
Producing gluts of oil that have nowhere to go but into storage facilities because as any idiot knows, if you have a choice between buying conventional crude at $X per barrel or that stuff that the fracking companies are producing at the same $X per barrel, the choice is clear. The U.S. light tight oil bonanza is producing a glut of unwanted oil. Some bonanza.
rockman on Fri, 27th Feb 2015 9:39 am
Folks – Y’all really need to let go of this “condensates, like the Eagle ford Shale production, are worthless” bullsh*t. Yes: they sell at a SMALL discount to heavier crudes but they do yield a good bit of gasoline and more then they yield diesel which is the real value globally of the heavy crudes.
Here’s some FACTS from http://allenergyconsulting.com/blog/2014/07/15/condensate-economics-explained/
“Running OMA refining model for the USGC Light Louisiana Sweet (LLS), Maya (Mexico Heavy Crude Oil), and Eagle Ford Condensate shows the following result in each configuration using the average USGC 2013 prices for Gasoline, iso & normal Butane, Jet, Propane, Diesel, Naphtha, Residual Fuel Oil, and Petroleum Coke. The value is essentially the revenue minus the variable cost obtain per barrel of feedstock. If LLS was processed in a cracking refinery, in the USGC they could expect $115/bbl of revenue per barrel. LLS averaged $106/bbl in 2013 – therefore a USGC refiner running LLS should have produced a margin of $9/bbl. This is not weighted nor optimized. An optimized refiner should have been able to extract more margin through better inventory management, purchasing, and offering a broader product suite.”
If you take the time to look at their chart you’ll see that the value to refiners of EFS condensate is just slightly less then that of sweet crude.
IOW the refiners (including the Canadians), though it costs a bit more to do so, are making a sh*t load of motor fuels from the condensates
Northwest Resident on Fri, 27th Feb 2015 9:57 am
rockman — No doubt, there is a lot of energy in that average barrel of fracked and/or tar sands liquid.
And it is true that some of the liquids being extracted from a few of the better plays are capable of being refined into decent quantities of diesel, as you point out.
But overall, on average, the barrel of fracked/tar sands oil is vastly more expensive to produce both in terms of money and energy spent when compared to conventional oil. And on average, the barrel of fracked/tar sands oil is more difficult and more costly to transport and to refine. And on average, the barrel of fracked/tar sands oil contains less energy.
I think shortonoil made the point that during this entire “oil glut” period, that American imports of oil have remained remarkably steady.
So, if we are importing the same amount of oil, then what are we putting into all the storage facilities? Are we importing SA and ME oil and putting it all into storage, while processing and powering our economy with fracked oil and tar sands oil? I don’t think so.
That fracked/tar sands oil is too expensive for what it is. Maybe some small percent of it is nearly comparable to conventional oil in terms of energy and mix. Probably those few “good” barrels of fracked oil are being processed and used. But the majority of the fracked stuff is going into storage and giving us Plant’s much trumpeted “oil glut”.
marmico on Fri, 27th Feb 2015 9:57 am
Wow, POD from Podunk and quart shy ETP can get it on the octagon.
Condensate is either “a sh*t load of motor fuels” or “camel piss”.
Place your wagers.
Once again, the U.S. refinery API gravity input slate.
You can break it down by PADD if you need 5 matches.
Davy on Fri, 27th Feb 2015 10:04 am
Marmie, If you were going to break me from doomism what is the most profound BAUtopian freddy fact you can tell me? Give me a fix of hopium and I am all yours.
marmico on Fri, 27th Feb 2015 10:16 am
Davy-boy, go brand your cattle for the umpteenth + 1 time such that you can maintain your position as a High Priest of the Church of the Doomer Apocalpse.
I wanna witness an empirical match of your religious word salad titans – POD v. ETP.
POD prevails.
shortonoil on Fri, 27th Feb 2015 10:24 am
If one looks at our 57 page report, “Depletion: A determination for the world’s petroleum reserves”, Campbell and Laherrere’s 1998 article is one of two studies used as a benchmark for the report. It gave the most definitive analysis know at the time, and is used to compare our determinations against. Their study is often criticized because it failed to identify the emergence of alternative sources. That is a straw man argument, as the alternatives will have no impact on the amount of usable crude that will ultimately be extracted.
The petroleum that Campbell and Laherrere studied offers an energy window; it was the substance that powers the world’s transportation fleet. It was conventional crude that lays between an API of 30 and 45. Crude outside of this range is incapable of powering the economy, and once conventional is depleted there will be little if any demand for the alternatives; as there will be little, or no economy remaining to demand it.
Their conclusion, at the time, that the ultimate amount of conventional crude that would be extracted would be 1,800 Gb was much maligned. Our research, which uses an entirely different methodology, comes to almost the same conclusion. Our determination is 1,760 Gb, a difference of 2.2%; which could hardly be a coincidence.
The reason that their evaluation was, and is so violently denied by many is that they were informing the oil world of what is in store for petroleum; they were not sugar coating it into what it wanted to hear.
http://www.thehillsgroup.org/
Pveroi on Fri, 27th Feb 2015 10:55 am
@yogi your post should be in quotation marks as you copy pasted that from a publication. Source would also be nice.
Davy on Fri, 27th Feb 2015 10:55 am
Marmie, we will see what you think of the twin predicaments of BAUtopianism when you are naked in the wind of change. One predicament being the depletion of the foundational commodity oil and the other the diminishing returns of a debt based financial system.
POD & ETP is a 4×4 and Freddy fluff is a 2×4. No Freddy fluff 2×4 can touch a POD & ETP 4×4 for reality traction. POD & ETP has unbeatable science behind it. Econ 101 is a failed pseudo-science of 20th century of which Freddy fluff is a corrupted version of its abstract principals. Econ 101 is the failed religion of the failed 20th century cornucopians.
Marm, take this to heart when you read your fluff.
Don’t believe everything you hear. Real eyes. Realize. Real lies
rockman on Fri, 27th Feb 2015 11:03 am
NR – True about the development costs for SOME of the condensate. But I also produce some from conventional reservoirs that cost me a lot less then it cost an EFS producer. But there are some heavy oils that cost as much or more to DEVELO than a bbl of EFS condemsate.
The obvious point is to realize that all condensate can br used to make a lot of motor fuels with the same profit margin but some condensate costs a lot more to develop than others.
Plantagenet on Fri, 27th Feb 2015 11:05 am
Yes, conventional oil peaked ca. 2005.
No, peak oil did not occur in 2005. Global oil production is now much higher then it was in 2005.
Clearly Campbell and Laherrere greatly underestimated the production rates we are seeing from shale oil and other unconventional oil.
Davy on Fri, 27th Feb 2015 11:41 am
Planter it is just a matter of terminology or just a matter of phrasing. It also matter what PO is to you. I am a dynamics systems guy. If we look at PO from the view point of POD & ETP then we are there and have been. If you are looking strictly at volumetrics then we have a Planter glut. I still like Marco’s GPO Glut Peak Oil. Anyway Planter not everyone thinks like Planter. We are using linear thought to describe a nonlinear world.
Plantagenet on Fri, 27th Feb 2015 11:57 am
Daver:
It turns out that oil is measured volumetrically–i.e. in barrels. There is no point in pretending otherwise.
Also, as Rockman says above, its just BS that Light Houston Sour oil (shale oil) is of poorer quality. LHS is priced the same as WTI because it is equally valuable.
Plantagenet on Fri, 27th Feb 2015 11:59 am
Make that “Light Houston Sweet” oil is priced the same as WTI.
Facts are facts.
Davy on Fri, 27th Feb 2015 12:11 pm
Planter can we look at PO from the actual economic of value of oil. I am talking the reality of what amount of quantifiable energy is delivered into the economy or should we use your Wall Street version? I like POD & ETP of oil because it is science. I am not an expert just asking because you seem to be an expert. I have read so many experts on PO from Wall Street. I think there are more geologist on Wall Street than accountants and lawyers. That amazing isn’t it Planter.
Plantagenet on Fri, 27th Feb 2015 12:17 pm
Daver
Its easy to measure the economic value of shale oil. Just look at the price of the LHS oil benchmark, which is the price of US shale oil. It is almost exactly the same as the WTI benchmark, i.e. shale oil and conventional oil are equally valuable.
Northwest Resident on Fri, 27th Feb 2015 12:35 pm
“its just BS that Light Houston SWEET oil (shale oil) is of poorer quality”
Really? Poorer quality than what? Maybe not poorer quality than WTI, but most definitely poorer quality than conventional SA/ME oil, which I believe was the original point made.
“The nature of LLS as a blend with somewhat limited specifications
allows for high variability in its quality, which is undesirable to some refiners and hedgers.” — NWR note: Because they have to recalibrate the refinery equipment with each new load, a hugely expensive and time consuming process.
Platts reviewed the infrastructure developments and the different
grades flowing into Houston to determine what type of crude it
should assess as the basis for its Light Houston Sweet marker.
Eagle Ford, with its meteoric rise in production and ample reserves,
was considered as a potential basis for LHS at Houston, but its
variability in quality precludes it from being a widely used marker.
Platts also considered Domestic Sweet Blend as a basis for its
LHS marker. Domestic Sweet is currently flowing into Houston
at an estimated 120,000 b/d on the Seaway pipeline, but quality
variability has raised concerns amongst the refining community.”
Plant, they can price that LHS at whatever they want to price it at, including the same price of WTI. But that doesn’t mean it is going to sell, does it? And just because you stick a high price tag on a horse with no teeth doesn’t make that horse as valuable as a horse WITH teeth. Surely even YOU can cognate that simple reality.
And how can you say that “LHS is priced the same as WTI because it is equally valuable” when LHS is not a precise quality — it varies substantially from load to load, depending on which hole they fracked it from.
Maybe you should have said, “…it is equally valuable, more or less, on average, depending…”
I await your false accusations, insulting comments and mischaracterization of what I have just written.
http://www.platts.com/IM.Platts.Content/MethodologyReferences/MethodologySpecs/Light-Houston-Sweet-WP.pdf
Plantagenet on Fri, 27th Feb 2015 2:16 pm
@Nordent:
1. “They” don’t price LHS. The market prices LHS. The prices are “SPOT” prices—-that means the prices actually paid for the oil on the day of sale.
2. If LHS isn’t selling as you claim, then why is it being sold? And for about the same price as WTI? Clearly LHS actually is selling at the SPOT price—thats the price it was sold at.
3. The prices of WTI, Brent and LHS are depressed due to the current oil glut. Sellers are desperate to move their product—and yet LHS is priced the same as WTI. By definition it is therefore just as valuable as WTI.
Cheers!
Northwest Resident on Fri, 27th Feb 2015 4:39 pm
glutster:
1. That’s what I meant by “they”
2. Where did I claim that LHS is NOT being sold? Another one of your standard false accusations and mischaracterizations?
3. You say that the depressed prices are the result of the oil glut. But the evidence and the informed opinions are unanimous that both the oil glut AND the falling price of oil are due to decrease in demand — demand destruction — inability to afford the too-high prices. You are the only one who stubbornly refuses to accept that crystal clear reality.
keith on Sat, 28th Feb 2015 3:27 pm
To keep pumping oil out of the ground, all you need to do is destroy the Global economy.
drift hunters on Tue, 16th May 2023 3:05 am
at the USGC, the price per barrel of LLS processed at a cracking refinery would be $115. A USGC refiner processing LLS in 2013 should have made a profit of $9 per barrel, given the average price of LLS that year of $106. It is not optimised nor weighted. Better inventory management, lower costs, and a wider variety of products offered by the refiner should have allowed for higher margins.