Donate Bitcoin

Donate Paypal


PeakOil is You

PeakOil is You

Debt, EROEI & GDP

Discussions about the economic and financial ramifications of PEAK OIL

Debt, EROEI & GDP

Unread postby MonteQuest » Tue 09 Feb 2016, 14:32:00

Nearly 100 years ago, one barrel of oil investment yielded 100 barrels more. In some places, it was 200 to 1. This high EROEI ratio built the global infrastructure and the global economy. Today, for every barrel of oil invested in global oil production, an average of roughly 10 to 20 are now extracted and turned into wealth, depending on who you ask. Oil per barrel produces less wealth today than in the past.

Image

This chart shows the run up in gas prices following the peak in US oil production in 1971, the gas crisis in 1973, and the abandonment of the gold standard in 1971. Notice how low and stable they were for decades.

Image

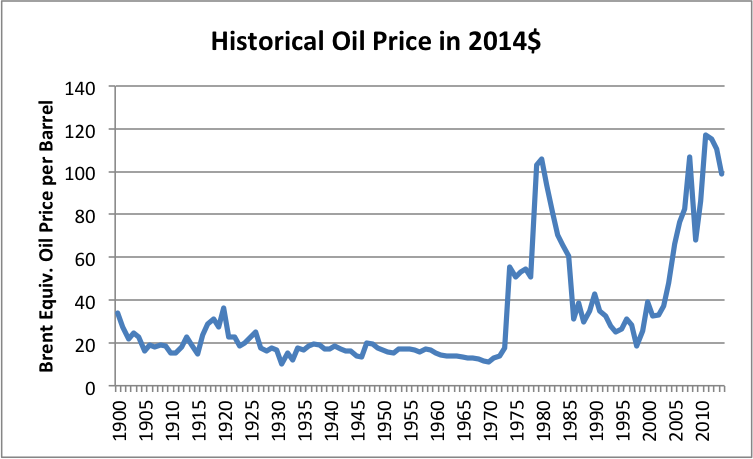
This chart shows the run-up in oil prices during the same era. Notice the decades long stability in price.

Image

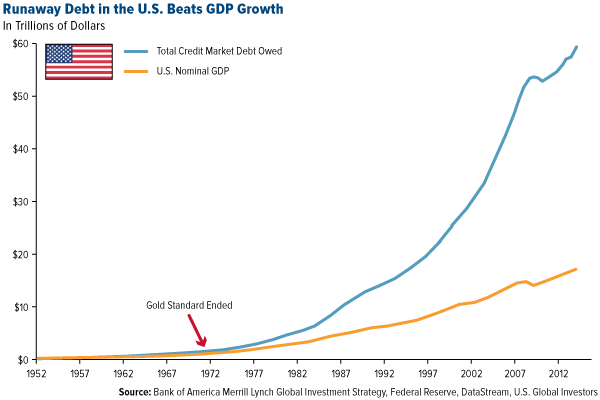
And this chart shows a corresponding increase in the debt to facilitate GDP growth as the ROI and EROEI wealth generating effect declined. It is no coincidence.

The change in the oil EROEI wealth creation, following the decline in US production in 1971, lower EROEI of oil production and rising oil prices, caused a new focus on service industries and on industries with little oil usage. Efficiency gains and outsourcing of oil energy industries soon followed. Still stymied by stagnation, financial speculation and huge increases in debt were employed to continue GDP growth. These measures help grow GDP–at least until the borrowers start defaulting on their loans or the market crashes due to being overpriced. Then, we bailout the markets; rinse and repeat, driving debt ever higher.

The problem with adding additional debt is that it at some point the amount of debt becomes too much for holders of the debt to service, and they start cutting back on other purchases. Debt saturation. Enter QE, ZIRP, NIRP, and now the talk of helicopter money.

In a recent study Awara Group Link reveals that the real GDP growth of Western countries has been in negative territory for years. The study has found that the Western countries have lost the capacity to grow their economies. All they have left is a capacity to pile up debts.

Image

This chart shows that Russia has been able to deliver real non-debt fueled GDP growth, whereas the Western countries are running huge deficits. Russia’s debt is only $515 billion dollars, close to US debt in the early 1970's.

Image

Western countries have currencies that the rest of the world still largely trusts as reserve currencies, allowing them to to gain access to cheap debt and fuel their economies with central bank financing (quantitative easing or “printing of money”). Will the West soon forfeit this privilege? What would follow is higher interest rates, and possibly, hyperinflation as the eventual outcome.

I guess we will try to keep up a semblance of prosperity with ever new debt, until we cannot.
A Saudi saying, "My father rode a camel. I drive a car. My son flies a jet-plane. His son will ride a camel."
User avatar
MonteQuest
Expert
Expert
 
Posts: 16593
Joined: Mon 06 Sep 2004, 03:00:00
Location: Westboro, MO

Re: Debt, EROEI & GDP

Unread postby Plantagenet » Tue 09 Feb 2016, 14:45:16

Good post, Monte.

Interesting topic.

But don't forget that the flip side of the economic slowdown in the developed countries, is the very rapid GDP growth in countries like China and India

Image
Cheers!
User avatar
Plantagenet
Expert
Expert
 
Posts: 26619
Joined: Mon 09 Apr 2007, 03:00:00
Location: Alaska (its much bigger than Texas).

Re: Debt, EROEI & GDP

Unread postby MonteQuest » Tue 09 Feb 2016, 16:14:34

Plantagenet wrote:Good post, Monte.

Interesting topic.

But don't forget that the flip side of the economic slowdown in the developed countries, is the very rapid GDP growth in countries like China and India


No flip side. We are at 103% of GDP. China is at 313% debt to GDP, heading for 346%. They are just debt driven GDP on steroids. Developing countries also get more bang for the buck than developed countries. Give somebody a scooter and a gallon of gas...and voila!

Image
A Saudi saying, "My father rode a camel. I drive a car. My son flies a jet-plane. His son will ride a camel."
User avatar
MonteQuest
Expert
Expert
 
Posts: 16593
Joined: Mon 06 Sep 2004, 03:00:00
Location: Westboro, MO

Re: Debt, EROEI & GDP

Unread postby Plantagenet » Tue 09 Feb 2016, 16:44:37

MonteQuest wrote:
No flip side. We are at 103% of GDP. China is at 313% debt to GDP, heading for 346%.


You are having another "apples vs. oranges" problem by comparing two different things. The US number you are using is for central government debt only. The China number you are using includes private and corporate borrowing for the whole country.

The total US debt is MUCH worse then you suggest.

government-debt-isnt-the-problemprivate-debt-is

US GDP is now about 17 trillion

us-total-debt-sixty-trillion

SInce US public and private debt is ca. 60 trillion, the US debt-to-GDP ratio number is actually more like 350%, i.e. about the same as China, except China is growing their GDP by about 7% per year, and our GDP growth was about .7% just last quarter.

CHEERS!
User avatar
Plantagenet
Expert
Expert
 
Posts: 26619
Joined: Mon 09 Apr 2007, 03:00:00
Location: Alaska (its much bigger than Texas).

Re: Debt, EROEI & GDP

Unread postby Outcast_Searcher » Tue 09 Feb 2016, 16:59:14

MonteQuest wrote:
Plantagenet wrote:Good post, Monte.

Interesting topic.

But don't forget that the flip side of the economic slowdown in the developed countries, is the very rapid GDP growth in countries like China and India


No flip side. We are at 103% of GDP. China is at 313% debt to GDP, heading for 346%. They are just debt driven GDP on steroids.

Geez Monte. You post a lot of economic opinions, but how about credible links or using figures that make any sense, such as consistency? When you fail to do that, you don't make a credible argument.

https://en.wikipedia.org/wiki/List_of_c ... ernal_debt

So, since you don't define what type of debt we are at, I presume at 103%, this is national debt for the US. Searching on "national debt by country" I get this as the above link near the top of the list, and the $18.7ish trillion sounds about right for the national debt. 103% of US GDP, just as you said.

Then I look at the comparable figure for China. Do I see 300%+? No, I see only 16.2% of Chinese GDP.

It seems like the 300+% figure you repeatedly use (I've seen you post this before fairly recently) for China is perhaps total debt? Googling "total chinese debt" I see a page of reasonably credible links from fall of 2015 using the figure of $28 trillion and about 280% of GDP, so that is at least ballpark.

At a glance, I see household, corporate, government, and financial debt listed in the figure.

Please don't compare (undefined) apples and pianos for economic figures and expect to be taken seriously.

And Planty is right. In general, 3rd world growth rates are high compared to first world countries. And they tend to slow down over time as the countries (like China) make significant economic progress. That's not doom -- that's the established norm for the economic national growth rate pattern.

https://en.wikipedia.org/wiki/List_of_c ... rowth_rate
Given the track record of the perma-doomer blogs, I wouldn't bet a fast crash doomer's money on their predictions.
User avatar
Outcast_Searcher
COB
COB
 
Posts: 10142
Joined: Sat 27 Jun 2009, 21:26:42
Location: Central KY

Re: Debt, EROEI & GDP

Unread postby Outcast_Searcher » Tue 09 Feb 2016, 17:15:02

MonteQuest wrote:Oil per barrel produces less wealth today than in the past.

Where? Based on what assumptions?

In first world countries, the economies are FAR less energy intensive than they used to be, and becoming less so is a solid trend. So the economy gets MORE bang per buck for what it needs to function than it did in the past, at least for first world countries.

Examples:

From 1980 to 2011, US energy intensity dropped by almost half. In the United Kingdom, by more than half. (These were the first and last years on the chart in my source).

https://www.eia.gov/cfapps/ipdbproject/ ... t=BTUPUSDM

Even without the oncoming rise of more green energy, that has to be a good thing. Why is that almost never mentioned in the doom scenarios?
Given the track record of the perma-doomer blogs, I wouldn't bet a fast crash doomer's money on their predictions.
User avatar
Outcast_Searcher
COB
COB
 
Posts: 10142
Joined: Sat 27 Jun 2009, 21:26:42
Location: Central KY

Re: Debt, EROEI & GDP

Unread postby MonteQuest » Tue 09 Feb 2016, 17:26:36

Outcast_Searcher wrote:
MonteQuest wrote:Oil per barrel produces less wealth today than in the past.

Where? Based on what assumptions?


EROEI drop from 100 to 1 to 10-20 to 1.

Outcast_Searcher wrote:In first world countries, the economies are FAR less energy intensive than they used to be, and becoming less so is a solid trend.


The main driver is relying on debt to grow GDP, as the study shows. The whole point of this thread. There is also the outsourcing overseas of jobs and energy intensive industries, service industries, and financial speculation. 1/3 of China's production goes to Western countries that used to produce the same products in house.
A Saudi saying, "My father rode a camel. I drive a car. My son flies a jet-plane. His son will ride a camel."
User avatar
MonteQuest
Expert
Expert
 
Posts: 16593
Joined: Mon 06 Sep 2004, 03:00:00
Location: Westboro, MO

Re: Debt, EROEI & GDP

Unread postby Outcast_Searcher » Tue 09 Feb 2016, 17:57:32

MonteQuest wrote:
Outcast_Searcher wrote:
MonteQuest wrote:Oil per barrel produces less wealth today than in the past.

Where? Based on what assumptions?


EROEI drop from 100 to 1 to 10-20 to 1.

Outcast_Searcher wrote:In first world countries, the economies are FAR less energy intensive than they used to be, and becoming less so is a solid trend.


The main driver is relying on debt to grow GDP, as the study shows. The whole point of this thread. There is also the outsourcing overseas of jobs and energy intensive industries, service industries, and financial speculation. 1/3 of China's production goes to Western countries that used to produce the same products in house.

However, correlation doesn't imply causation. Just because advanced economies use debt doesn't mean that the only driver (or even that a primary driver) is the unaffordability of oil.

Oil is now dirt cheap, relatively speaking. Do you expect the US to show a large budget surplus as a result? You should, IF high oil prices were the main cause of the debt.
Given the track record of the perma-doomer blogs, I wouldn't bet a fast crash doomer's money on their predictions.
User avatar
Outcast_Searcher
COB
COB
 
Posts: 10142
Joined: Sat 27 Jun 2009, 21:26:42
Location: Central KY

Re: Debt, EROEI & GDP

Unread postby marmico » Tue 09 Feb 2016, 18:05:17

There is no correlation between U.S. debt to GDP and energy expenditures to GDP.

https://www.eia.gov/totalenergy/data/mo ... ec1_17.pdf

Energy spending peaked at 13.7% of GDP in 1981, declined to 5.8% in 1999, rose to 9.6 % in 2008 and will print about 6.2% in 2015. Meanwhile, debt continuously rose.
marmico
Heavy Crude
Heavy Crude
 
Posts: 1112
Joined: Mon 28 Jul 2014, 14:46:35

Re: Debt, EROEI & GDP

Unread postby MonteQuest » Tue 09 Feb 2016, 20:04:14

Outcast_Searcher wrote: However, correlation doesn't imply causation. Just because advanced economies use debt doesn't mean that the only driver (or even that a primary driver) is the unaffordability of oil.


Not using correlation to imply causation. I'm using the studies findings. Read them and debunk them. The main driver of GDP is increasing debt in advanced economies. How much effect rising prices, declining EROEI and unstable prices has contributed to the debt explosion in order to grow seems to be quite relevant. Debt is so high now, that even low oil prices may not spur growth.
A Saudi saying, "My father rode a camel. I drive a car. My son flies a jet-plane. His son will ride a camel."
User avatar
MonteQuest
Expert
Expert
 
Posts: 16593
Joined: Mon 06 Sep 2004, 03:00:00
Location: Westboro, MO

Re: Debt, EROEI & GDP

Unread postby MonteQuest » Tue 09 Feb 2016, 20:12:18

marmico wrote:There is no correlation between U.S. debt to GDP and energy expenditures to GDP.

https://www.eia.gov/totalenergy/data/mo ... ec1_17.pdf

Energy spending peaked at 13.7% of GDP in 1981, declined to 5.8% in 1999, rose to 9.6 % in 2008 and will print about 6.2% in 2015. Meanwhile, debt continuously rose.


In the early 80's trade agreements moved energy intensive industries overseas. Service industries shot up. Financial speculation abounded. Our energy footprint declined and was shifted overseas. Debt continued to rise even with these cuts and outsourcing in consumption. That's the point.

Debt drives GDP in the face of diminishing returns from energy use as prices rise and EROEI declines.
A Saudi saying, "My father rode a camel. I drive a car. My son flies a jet-plane. His son will ride a camel."
User avatar
MonteQuest
Expert
Expert
 
Posts: 16593
Joined: Mon 06 Sep 2004, 03:00:00
Location: Westboro, MO

Re: Debt, EROEI & GDP

Unread postby marmico » Tue 09 Feb 2016, 20:31:53

The imbedded energy costs in exports adds to GDP and the embedded energy costs in imports subtracts from GDP.

EROI decline is much ado about nothing. The EROI argument hinges on 3.33 additional consumed units out of 100 units. Gasoline was mostly a waste product @100 EROI. @30 (15) EROI, of 100 units of energy extracted at the well, 96.67 (93.33) units flow towards the refinery.
marmico
Heavy Crude
Heavy Crude
 
Posts: 1112
Joined: Mon 28 Jul 2014, 14:46:35

Re: Debt, EROEI & GDP

Unread postby ralfy » Tue 09 Feb 2016, 20:37:59

EROI becomes critical if more from the rest of the world want more than just oil used for needs:

http://www.bbc.co.uk/news/business-22956470

The current middle class is relying on that because expanding markets are the only way they will be able to get more income and returns on their investment. These are all part of continuous economic growth, which can only take place as long as there are no limits to growth. Unfortunately,

http://www.theguardian.com/commentisfre ... g-collapse
User avatar
ralfy
Light Sweet Crude
Light Sweet Crude
 
Posts: 5600
Joined: Sat 28 Mar 2009, 11:36:38
Location: The Wasteland

Re: Debt, EROEI & GDP

Unread postby MonteQuest » Tue 09 Feb 2016, 20:40:48

Outcast_Searcher wrote:Geez Monte. You post a lot of economic opinions, but how about credible links or using figures that make any sense, such as consistency? When you fail to do that, you don't make a credible argument.


Those are credible figures. I assumed you would know I was referring to the national debt, as Debt to GDP is almost always referenced as such.

US debt to GDP is 103%

China's debt to GDP is 313%

Forbes reported it as 280% in May 2015. FX Street estimated 312% at yr end.

Our estimate for China’s broadest debt-to-GDP ratio covering both the public and private sectors continues to rise, and at the end of 2015 we estimate it stood at 312%, Indeed, if from 2012 onwards we increase China’s nominal GDP by the rate shown in the Li Keqiang index rather than official GDP data, we see that 2015 debt-to-GDP might be as high as 346%.


Link
US debt is $19 trillion. US debt in 1971 was $300 billion. 19-3= $18.7 trillion
A Saudi saying, "My father rode a camel. I drive a car. My son flies a jet-plane. His son will ride a camel."
User avatar
MonteQuest
Expert
Expert
 
Posts: 16593
Joined: Mon 06 Sep 2004, 03:00:00
Location: Westboro, MO

Re: Debt, EROEI & GDP

Unread postby MonteQuest » Tue 09 Feb 2016, 20:47:38

Outcast_Searcher wrote: And Planty is right. In general, 3rd world growth rates are high compared to first world countries. And they tend to slow down over time as the countries (like China) make significant economic progress. That's not doom -- that's the established norm for the economic national growth rate pattern.


Didn't imply it was doom. A gallon of gas has more utility in an undeveloped country regardless of price, which is one of the factors contributing to non-OECD growth of 20% after the rise in oil prices and the 2008 crash.
A Saudi saying, "My father rode a camel. I drive a car. My son flies a jet-plane. His son will ride a camel."
User avatar
MonteQuest
Expert
Expert
 
Posts: 16593
Joined: Mon 06 Sep 2004, 03:00:00
Location: Westboro, MO

Re: Debt, EROEI & GDP

Unread postby MonteQuest » Tue 09 Feb 2016, 21:04:50

marmico wrote:EROI decline is much ado about nothing.


Ok. Then the question arises, if it wasn't the sudden instability in oil and gas prices, and the sudden rising cost of oil and gasoline, coupled with the declining EROEI of FF's, what caused the sudden need for a rapid rise in debt? In the US, we went from $300 billion to $19 trillion in 45 years. Going off the gold standard allowed us to expand the money supply and offered easy credit. If it was a desire to live beyond our means, then why have we struggled to grow GDP with all this infusion? Shouldn't GDP have tracked the growth in debt?

Why did it not?

Debt saturation as early as the 1970's?

What say you?
A Saudi saying, "My father rode a camel. I drive a car. My son flies a jet-plane. His son will ride a camel."
User avatar
MonteQuest
Expert
Expert
 
Posts: 16593
Joined: Mon 06 Sep 2004, 03:00:00
Location: Westboro, MO

Re: Debt, EROEI & GDP

Unread postby marmico » Tue 09 Feb 2016, 22:03:41

U.S. household debt rose relative to GDP because the value of the stock of residential real estate and consumer durable goods rose faster than GDP. Remember stocks and flows.

U.S. federal government debt rose relative to GDP because transfers (Social Security, Medicare, Medicaid, etc.) to households rose faster than GDP.

Now you tell me why U.S. nonfinancial business debt rose.
marmico
Heavy Crude
Heavy Crude
 
Posts: 1112
Joined: Mon 28 Jul 2014, 14:46:35

Re: Debt, EROEI & GDP

Unread postby MonteQuest » Tue 09 Feb 2016, 22:18:12

marmico wrote:U.S. household debt rose relative to GDP because the value of the stock of residential real estate and consumer durable goods rose faster than GDP. Remember stocks and flows.

U.S. federal government debt rose relative to GDP because transfers (Social Security, Medicare, Medicaid, etc.) to households rose faster than GDP.

Now you tell me why U.S. nonfinancial business debt rose.


For 45 years? What's your point?
A Saudi saying, "My father rode a camel. I drive a car. My son flies a jet-plane. His son will ride a camel."
User avatar
MonteQuest
Expert
Expert
 
Posts: 16593
Joined: Mon 06 Sep 2004, 03:00:00
Location: Westboro, MO

Re: Debt, EROEI & GDP

Unread postby marmico » Wed 10 Feb 2016, 04:45:57

What a pissant!
marmico
Heavy Crude
Heavy Crude
 
Posts: 1112
Joined: Mon 28 Jul 2014, 14:46:35


Return to Economics & Finance

Who is online

Users browsing this forum: ralfy and 103 guests