apparently Mr. Hubbards rock oil shortage as predicted in the 1950's did not take place in time - leaves us all with one specific conclusion:
oil is not the remnant of "Sinclair Oil" dinosaur left over -semi plastic- indigestible somemthn` somethn..
the theory in itself is correct !


PeakOil is You
Rock Oil
Re: Rock Oil
![]() by sparky » Tue 19 Jul 2016, 01:50:36
by sparky » Tue 19 Jul 2016, 01:50:36
.
Marion Hubbert paper was specifically referring to conventional oil extraction in the U.S.
no deep sea , no tight oil, no extra heavy ,
within those parameters his forecast was spotlessly accurate .
depletion of an extracted finite resource is a fact ,
peak extraction of this resource is also a fact .
It has been the case for all sort of extractive industries since the dawn of civilization .
If you have some facts faulting this .... please , please give them ,I for one would be very happy
-

sparky - Intermediate Crude

- Posts: 3587
- Joined: Mon 09 Apr 2007, 03:00:00
- Location: Sydney , OZ
Re: Rock Oil
![]() by regardingpo » Tue 19 Jul 2016, 07:00:37
by regardingpo » Tue 19 Jul 2016, 07:00:37
sparky wrote:.
Marion Hubbert paper was specifically referring to conventional oil extraction in the U.S.
no deep sea , no tight oil, no extra heavy ,
within those parameters his forecast was spotlessly accurate .
Exactly. The only people who say Hubbert was wrong are the ones who don't even know what he was talking about. Or they're trying to set up a strawman argument.
Don't follow this link: http://bit.ly/2dtWSrZ
-

regardingpo - Peat

- Posts: 106
- Joined: Thu 20 Aug 2015, 15:36:52
Re: Rock Oil
![]() by AdamB » Tue 19 Jul 2016, 14:08:59
by AdamB » Tue 19 Jul 2016, 14:08:59
aldente wrote:apparently Mr. Hubbards rock oil shortage as predicted in the 1950's did not take place in time - leaves us all with one specific conclusion:
oil is not the remnant of "Sinclair Oil" dinosaur left over -semi plastic- indigestible somemthn` somethn..
the theory in itself is correct !
Which theory? The one Hubbert used to predict peak oil by 1950 in the US, or later when he used a theory to predict that the world would peak at 12 billion barrels a year? Somewhere in the last century?
Plant Thu 27 Jul 2023 "Personally I think the IEA is exactly right when they predict peak oil in the 2020s, especially because it matches my own predictions."
Plant Wed 11 Apr 2007 "I think Deffeyes might have nailed it, and we are just past the overall peak in oil production. (Thanksgiving 2005)"
Plant Wed 11 Apr 2007 "I think Deffeyes might have nailed it, and we are just past the overall peak in oil production. (Thanksgiving 2005)"
-

AdamB - Volunteer
- Posts: 9292
- Joined: Mon 28 Dec 2015, 17:10:26
Re: Rock Oil
![]() by AdamB » Tue 19 Jul 2016, 14:13:45
by AdamB » Tue 19 Jul 2016, 14:13:45
regardingpo wrote:sparky wrote:.
Marion Hubbert paper was specifically referring to conventional oil extraction in the U.S.
no deep sea , no tight oil, no extra heavy ,
within those parameters his forecast was spotlessly accurate .
Exactly. The only people who say Hubbert was wrong are the ones who don't even know what he was talking about. Or they're trying to set up a strawman argument.
Exactly. It can't be the data that invalidated his ideas, no sirree bob.
THE DATE-RR MUST BE WRONG!!!
Plant Thu 27 Jul 2023 "Personally I think the IEA is exactly right when they predict peak oil in the 2020s, especially because it matches my own predictions."
Plant Wed 11 Apr 2007 "I think Deffeyes might have nailed it, and we are just past the overall peak in oil production. (Thanksgiving 2005)"
Plant Wed 11 Apr 2007 "I think Deffeyes might have nailed it, and we are just past the overall peak in oil production. (Thanksgiving 2005)"
-
AdamB - Volunteer
- Posts: 9292
- Joined: Mon 28 Dec 2015, 17:10:26
Re: Rock Oil
![]() by ROCKMAN » Tue 19 Jul 2016, 16:39:35
by ROCKMAN » Tue 19 Jul 2016, 16:39:35
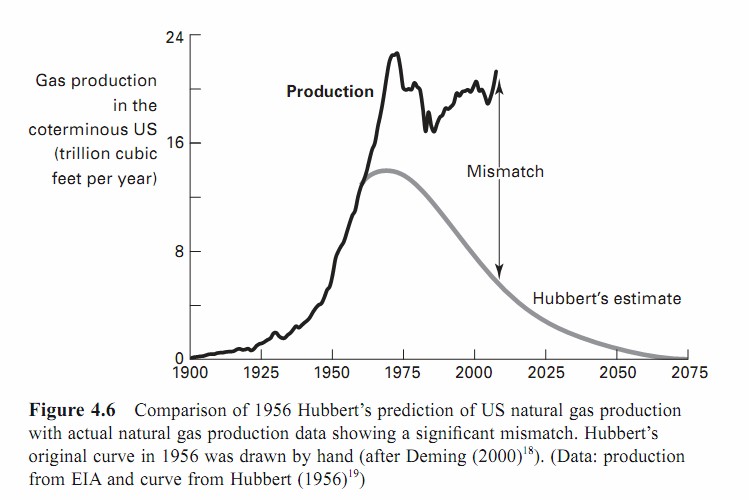
Neither data is wrong. They just represent two different dynamics. Hubbert's curve represented the future production curve of the known trends his population data represented. Which did prove to be rather acurate. The other curve presented represents production from all NG trends including those that Hubbert SPECIFICALLY said were not included in his projection. Of course one would only know that if they actually studied the details of his work.
-

ROCKMAN - Expert

- Posts: 11397
- Joined: Tue 27 May 2008, 03:00:00
- Location: TEXAS
Re: Rock Oil
![]() by AdamB » Tue 19 Jul 2016, 17:40:11
by AdamB » Tue 19 Jul 2016, 17:40:11
ROCKMAN wrote:Neither data is wrong. They just represent two different dynamics. Hubbert's curve represented the future production curve of the known trends his population data represented. Which did prove to be rather acurate. The other curve presented represents production from all NG trends including those that Hubbert SPECIFICALLY said were not included in his projection. Of course one would only know that if they actually studied the details of his work.
We've done this before Rockman. Hubbert had more UNDISCOVERED fields in his US analysis than he did existing known reserves. So of course he didn't just predict from KNOWN trends in only the given population, he had this whole other population that he, and no one else, had yet found or knew about yet. And he included that as well. Explicitly demonstrated in one of his figures, that those of us who have studied his work should have memorized by now, but you know which one I'm talking about.
And Hubbert didn't SPECIFICALLY exclude shales, which are really the trend that dynamited his natural gas prediction. I think it is time to state as fact that simplistic modeling, such as a bell shaped curve to represent aggregate oil or gas production, is bunkum. It doesn't represent field level production, not even close to the normal stylized profile utilized by various energy experts and organizations, from the EIA to XOM, it certainly isn't well level production, it occasionally appears to line up with some resource bases that are limited in nature and developed under specific economic conditions, but the last analysis I've seen (BEFORE the shales blew up the US production profile into the sine curve of oil production) has country level production following a Hubbert curve at maybe 20% of the worlds volumes. So it just doesn't work for the vast majority of production, and will only get worse in this regard as more resources are added on after some countries have entered decline, and like the US, get a chance to repeak all over again.
Plant Thu 27 Jul 2023 "Personally I think the IEA is exactly right when they predict peak oil in the 2020s, especially because it matches my own predictions."
Plant Wed 11 Apr 2007 "I think Deffeyes might have nailed it, and we are just past the overall peak in oil production. (Thanksgiving 2005)"
Plant Wed 11 Apr 2007 "I think Deffeyes might have nailed it, and we are just past the overall peak in oil production. (Thanksgiving 2005)"
-
AdamB - Volunteer
- Posts: 9292
- Joined: Mon 28 Dec 2015, 17:10:26
Re: Rock Oil
![]() by ROCKMAN » Wed 20 Jul 2016, 16:03:07
by ROCKMAN » Wed 20 Jul 2016, 16:03:07
pstarr - Actually they had been producing the Eagle Ford in the 1940's but the volume was insignificantly small. They may have been included in Hubbert's analysis but would have been meaningless. I suspect all of the arguments directed at my statements are a result of some folks reading what others IMPLY Hubbert said as opposed to reading his actual work.
And to be clear on the stats he used to make his US PO date prediction: he used the cumulative production history and decline rates of ALL THE SIGNIFICANT OIL TRENDS in the country that had been developed AT THAT TIME. And to not take anything away from his work but those trends were rather mature when he built his model.
Here's a simple and accurate explanation. You have a bag with a large but unknown number of white and black marbles. You can't tell what % are black can you? But you pull 10 out and 3 are black. How comfortable are you predficting that 30% of the marbles are black? Not too comfortable, I hope. LOL. But now you pull 600 out and 180 are black. How do you feel about the 30% stat now?
That's essentially was what Hubbert did: he sampled a very large number of existing US oil fields...essentially all of the known trends. Fields that had been almost fully developed and thus had a good handle on URR. And now to carry this simple analogy further: you feel good that 30% of the remaining marbles are black, right? That is untill someone dumps an unknown number of black marbles into the bag. Which is essentially what happened when oil prices shot up: it created a new population distribution in your bag...a lot of new black marbles. And until you draw a new large sample out you can't predict the future, can you? But then you do just that (drill a lot of shale wells) and now you think you can make a forecast, right? But when you're not looking some bastard sneaks some of the black marbles out of the bag (oil prices fall).
And this is where you are today: how many black marbles and shale wells are in your future? Work on that and let me know what you come up with. LOL
-
ROCKMAN - Expert
- Posts: 11397
- Joined: Tue 27 May 2008, 03:00:00
- Location: TEXAS
Re: Rock Oil
![]() by ROCKMAN » Wed 20 Jul 2016, 16:14:28
by ROCKMAN » Wed 20 Jul 2016, 16:14:28
pstarr - And what really made Hubbert a star in his day wasn't so much the PO date prediction but recognizing that oil field size distribution followed a near perfect log-normal distribution. Turns out Mother Earth loves log-normal distributions. You can search that phenominon if interested. Kinda ties in with Fibonnaci numbers, another very interesting NATURAL phenomenon.
-
ROCKMAN - Expert
- Posts: 11397
- Joined: Tue 27 May 2008, 03:00:00
- Location: TEXAS
Re: Rock Oil
![]() by ROCKMAN » Wed 20 Jul 2016, 16:18:45
by ROCKMAN » Wed 20 Jul 2016, 16:18:45
pstarr - And what really made Hubbert a star in his day wasn't so much the PO date prediction but recognizing that oil field size distribution followed a near perfect log-normal distribution. Turns out Mother Earth loves log-normal distributions. You can search that phenominon if interested. Kinda ties in with Fibonnaci numbers, another very interesting NATURAL phenomenon.
-
ROCKMAN - Expert
- Posts: 11397
- Joined: Tue 27 May 2008, 03:00:00
- Location: TEXAS
Re: Rock Oil
![]() by aldente » Fri 22 Jul 2016, 04:51:49
by aldente » Fri 22 Jul 2016, 04:51:49
Thanks for mentioning the Fibonacci numbers Rockman - I do not know much about them but conclude that they reflect the large within the small and in reverso (italian).
regarding Peak Oil in general - as far as I recall I always was biting granite with everyone that I did try to convey the concept to - especially my own wife - which since divorced me - on basis that I supposedly am an "end-timer"- bla, bla--- while she now runs to the church herself where the so called apocalypse is preached.
Go figure - lots of heartbreak over such a simple matter-
all that Peak Oil states is the Gauss Bell Curve, which has been discovered by a school boy with last name Gauss in Germany in the end 1700's -to my knowledge (no quotation on the date - but how cares anyway these days -as if the psychotronic- psycho "non"-sexual (if the "non" is not written this post will be cencored) -psychon-non - understandable 2string theory would be in accordance with the original principal of making the world free from the hokus-pokus of religion... now we are back to it - string theory3 is on the way...
-

aldente - Permanently Banned
- Posts: 1554
- Joined: Fri 20 Aug 2004, 03:00:00
Re: Rock Oil
![]() by AdamB » Fri 22 Jul 2016, 10:33:04
by AdamB » Fri 22 Jul 2016, 10:33:04
pstarr wrote:Is that right? Hubbet modeled imaginary reserves. Wow! I like to see that reference, please. I am interested.AdamB wrote:ROCKMAN wrote:Neither data is wrong. They just represent two different dynamics. Hubbert's curve represented the future production curve of the known trends his population data represented. Which did prove to be rather acurate. The other curve presented represents production from all NG trends including those that Hubbert SPECIFICALLY said were not included in his projection. Of course one would only know that if they actually studied the details of his work.
We've done this before Rockman. Hubbert had more UNDISCOVERED fields in his US analysis than he did existing known reserves.
No you aren't. Otherwise you would found it in his 1956 paper already, and wouldn't have forgotten it from the last time someone mentioned it and you really were ignorant about the facts of his work.
http://www.hubbertpeak.com/hubbert/1956/1956.pdf
Figure 20 and Figure 22, just so you can't say AGAIN that you cherish ignorance when it comes to peak oil minutia.
pstarr wrote: Please illustrate with references. Thanks in advance.
See above.
pstarr wrote:I rather doubt that shale NG was represented in the data that Hubbert modeled as folks were not producing tight shale then. Just as folks today are not producing off-planet NGL's. So we don't include those in resource or reserve counts.
Hey Adam, fess up . . . it's all BS right?
Pstarr, you have already proven you don't even know what reserves are. Would you care to elaborate on needing 6D seismic before declaring them, prior to any of us pretending you have honestly disavowed your prior silly statements on the topic?
Plant Thu 27 Jul 2023 "Personally I think the IEA is exactly right when they predict peak oil in the 2020s, especially because it matches my own predictions."
Plant Wed 11 Apr 2007 "I think Deffeyes might have nailed it, and we are just past the overall peak in oil production. (Thanksgiving 2005)"
Plant Wed 11 Apr 2007 "I think Deffeyes might have nailed it, and we are just past the overall peak in oil production. (Thanksgiving 2005)"
-
AdamB - Volunteer
- Posts: 9292
- Joined: Mon 28 Dec 2015, 17:10:26
Re: Rock Oil
![]() by AdamB » Fri 22 Jul 2016, 10:48:06
by AdamB » Fri 22 Jul 2016, 10:48:06
ROCKMAN wrote:pstarr - And what really made Hubbert a star in his day wasn't so much the PO date prediction but recognizing that oil field size distribution followed a near perfect log-normal distribution.
What might the standard deviation be on a "perfect" log-normal distribution Rockman?

And Hubbert doesn't tend to get create for discovery process modeling basics, Arps and Roberts do. I haven't even ever seen a Hubbert explanation for the economic truncation effect, which is part and parcel of why a discovery distribution is a log normal. If the economic truncation is stripped away, you have more than a few people arguing for a pareto, I believe canada uses a model based on just such a distribution. The USGS plays a different game, using a truncated and shifted log-normal, and the agency formerly known as MMS uses a REALLY old version of the same idea, again log normals.
But I don't know what a "perfect" log-normal is Rockman. Or Hubbert figuring it out prior to Arps and Roberts. You see it as a common reference in resource assessment methodology, particular that coming from the USGS.
Gordon Kaufman is one of the past masters of this type of statistical method, here is one of his papers discussing quite a bit of it, and notice the Arps and Roberts reference.
http://dspace.mit.edu/bitstream/handle/ ... .pdf?seque
The Arps and Roberts reference is this:
Arps, J. K. and T. G. Roberts (1958). "Economics of Drilling for Cretaceous
Oil and Gas on the East Flank of the Denver-Julesberg Basin."
American Association of Petroleum Geologists Bulletin 42(11): 2549-
2566.
If you are interested in the Survey explanations of the economic truncation effect, Emil has a reference in the same paper:
Attanasi, E. D. and L. J. Drew (1985). "Lognormal Field Size Distributions as
a Consequence of Economic Truncation." Mathematical Geology 17(4):
335-351.
I haven't seen Gordon since about 2010, he might be retired and moved on by now, but Emil still works for the Survey, although many of his colleagues who did ground breaking work in this arena have moved on.
For those interested in a less technical discussion on how this stuff works, I recommend Larry Drew and his book, he was around when "the rockets were born" as well.
https://www.amazon.com/Estimation-futur ... +drew+usgs
Rockman wrote:Turns out Mother Earth loves log-normal distributions. You can search that phenominon if interested. Kinda ties in with Fibonnaci numbers, another very interesting NATURAL phenomenon.
Depends upon your exclusion or inclusion of the economic truncation effect I suppose.
The only reason I am familiar with this issue is because the US and Canada Survey's had to come to grips with different answers back when the Canadians were trying to get up to speed with US geologically based assessments. The two Survey's calculated different numbers, and needed to hash out the "why". Economic truncation causes international incident!
But if you've got Hubbert showing data with log normal fits and explaining or theorizing anything on the sample without replacement issue as a means of casting undiscovered fields going forward, I would really like to see it. The USGS once used Hubbert's reserve growth equations, but their literature references for the method used in discovery process modeling starts with Arps and Roberts.
Plant Thu 27 Jul 2023 "Personally I think the IEA is exactly right when they predict peak oil in the 2020s, especially because it matches my own predictions."
Plant Wed 11 Apr 2007 "I think Deffeyes might have nailed it, and we are just past the overall peak in oil production. (Thanksgiving 2005)"
Plant Wed 11 Apr 2007 "I think Deffeyes might have nailed it, and we are just past the overall peak in oil production. (Thanksgiving 2005)"
-
AdamB - Volunteer
- Posts: 9292
- Joined: Mon 28 Dec 2015, 17:10:26
Re: Rock Oil
![]() by AdamB » Fri 22 Jul 2016, 15:11:53
by AdamB » Fri 22 Jul 2016, 15:11:53
pstarr wrote:Come adam. You don't have the faintest idea what or why you are going on about. And your Hubbert link above is also air-headed. It's empty.
Whatever you say Mr pstarr. Figure 20 and 22, feel free to google up your own version of the report, every one I've seen has the figures.
But you aren't really interested in knowing anything on this topic right? A little too much "instructional" work in your past perhaps?
Plant Thu 27 Jul 2023 "Personally I think the IEA is exactly right when they predict peak oil in the 2020s, especially because it matches my own predictions."
Plant Wed 11 Apr 2007 "I think Deffeyes might have nailed it, and we are just past the overall peak in oil production. (Thanksgiving 2005)"
Plant Wed 11 Apr 2007 "I think Deffeyes might have nailed it, and we are just past the overall peak in oil production. (Thanksgiving 2005)"
-
AdamB - Volunteer
- Posts: 9292
- Joined: Mon 28 Dec 2015, 17:10:26
Re: Rock Oil
![]() by AdamB » Fri 22 Jul 2016, 15:30:33
by AdamB » Fri 22 Jul 2016, 15:30:33
pstarr wrote:Come on adam, we deserve a little more respect than this: this site can’t be reached. You don't even bother to reach what you cut and paste.
Works fine for me, as is. Feel free to google up Hubbert's 1956 paper elsewhere, it isn't hard to find.
pstarr wrote:AdamB wrote:But you aren't really interested in knowing anything on this topic right? A little too much "instructional" work in your past perhaps?
Come on Adam. No one here is interested in your 'instructional' work . . . because it is so much BS.
Is avoiding all learning really the best your "instructional" complex could advocate for you, back in the day? They really must not have expected much from the Vo-Ag gang.
Plant Thu 27 Jul 2023 "Personally I think the IEA is exactly right when they predict peak oil in the 2020s, especially because it matches my own predictions."
Plant Wed 11 Apr 2007 "I think Deffeyes might have nailed it, and we are just past the overall peak in oil production. (Thanksgiving 2005)"
Plant Wed 11 Apr 2007 "I think Deffeyes might have nailed it, and we are just past the overall peak in oil production. (Thanksgiving 2005)"
-
AdamB - Volunteer
- Posts: 9292
- Joined: Mon 28 Dec 2015, 17:10:26
Re: Rock Oil
![]() by rockdoc123 » Fri 22 Jul 2016, 15:31:27
by rockdoc123 » Fri 22 Jul 2016, 15:31:27
And Hubbert doesn't tend to get create for discovery process modeling basics, Arps and Roberts do. I haven't even ever seen a Hubbert explanation for the economic truncation effect, which is part and parcel of why a discovery distribution is a log normal. If the economic truncation is stripped away, you have more than a few people arguing for a pareto, I believe canada uses a model based on just such a distribution. The USGS plays a different game, using a truncated and shifted log-normal, and the agency formerly known as MMS uses a REALLY old version of the same idea, again log normals.
But I don't know what a "perfect" log-normal is Rockman. Or Hubbert figuring it out prior to Arps and Roberts. You see it as a common reference in resource assessment methodology, particular that coming from the USGS.
Rockman is correct in stating that nature tends to follow log-normal rather than normal or Gaussian distributions. If I recall correctly the reason is that when you start to multiple a bunch of independent normal distributed variables the outcome is log-normal. In the case of reserves you are multiplying height of pay, porosity, Formations volume factor, water saturation and recovery factor. In practice I was used to using either @Risk or Crystal Ball to create customized distributions that were based on a log normal model but were truncated for economic reasons on the low side and sometimes for leak/spill considerations on the high side. Multiplying them all together you get reserves that are log normally distributed but are not truncated (the truncations already having been taken into account in the variables and the Monte Carlo sampling). The log normal distribution is important as it indicates that your probability between the high side and 2sigma is quite low, meaning you should not be expecting to see the big reserves (nice when it happens though).
-
rockdoc123 - Expert
- Posts: 7685
- Joined: Mon 16 May 2005, 03:00:00
Re: Rock Oil
![]() by ROCKMAN » Fri 22 Jul 2016, 15:41:57
by ROCKMAN » Fri 22 Jul 2016, 15:41:57
Adam - The SD would be insignificantly small. "I don't know what a "perfect" log-normal is Rockman. Or Hubbert figuring it out prior to Arps and Roberts. You see it as a common reference in resource assessment methodology, particular that coming from the USGS." Not perfect... I said near perfect. And so folks understand what a log-normal distribution looks like: plot any data with the horizontal scale linear (like 10...20...30...40...etc.) and the vertical scale as a log(10): 10...100...1,000,..etc.
Many natural data sets will plot out a very straight line when done on a log-normal chart. ESuch as reservoir side distribution: many more small ones the large ones (one of Hubbert's clues). Works very well with pressure depletion reservoirs such as the shales: once the initial high decline rate has passed the remaining curve looks like a near perfect straight line that can be used to make a fairly accurate estimate of URR.
Many natural data sets will plot out a very straight line when done on a log-normal chart. ESuch as reservoir side distribution: many more small ones the large ones (one of Hubbert's clues). Works very well with pressure depletion reservoirs such as the shales: once the initial high decline rate has passed the remaining curve looks like a near perfect straight line that can be used to make a fairly accurate estimate of URR.
-
ROCKMAN - Expert
- Posts: 11397
- Joined: Tue 27 May 2008, 03:00:00
- Location: TEXAS
42 posts
• Page 1 of 3 • 1, 2, 3
Who is online
Users browsing this forum: No registered users and 46 guests