Donate Bitcoin

Donate Paypal


PeakOil is You

PeakOil is You

The Curious Case of the Three Projections

General discussions of the systemic, societal and civilisational effects of depletion.

The Curious Case of the Three Projections

Unread postby dashster » Wed 09 Apr 2014, 20:59:48

The EIA has three projections for US crude oil production out to 2040.

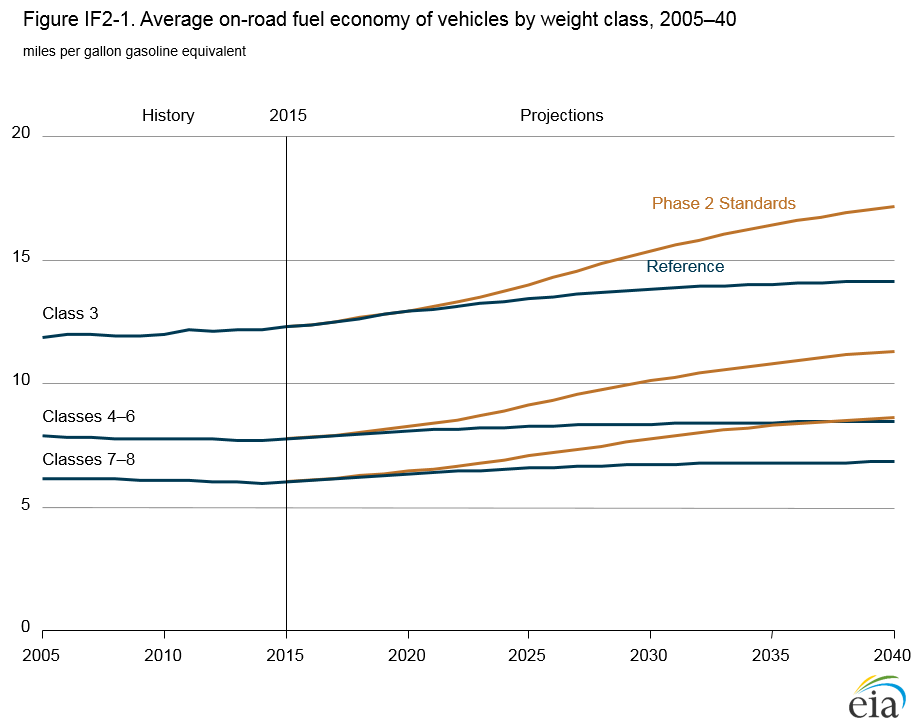
They refer to the projections as "Low Oil and Gas Resource", "Reference", and "High Oil and Gas Resource". But one of the three looks remarkably different from the other two. Astonishingly different:

Image
dashster
Lignite
Lignite
 
Posts: 385
Joined: Fri 28 Dec 2012, 08:39:24
Location: California

Re: The Curious Case of the Three Projections

Unread postby collapsenik » Wed 09 Apr 2014, 21:39:45

So…does anyone know why?
collapsenik
Wood
Wood
 
Posts: 28
Joined: Sat 25 Jan 2014, 18:58:51

Re: The Curious Case of the Three Projections

Unread postby Tanada » Thu 10 Apr 2014, 04:36:21

One is based on all known facts, one adds a fudge factor because thinks can always go wrong, and one is hopelessly optimistic because this is an election year and the people seeking reelection on all sides want some good news to use in campaign commercials. Yes I am hopelessly cynical about government reports and political influence.
Alfred Tennyson wrote:We are not now that strength which in old days
Moved earth and heaven, that which we are, we are;
One equal temper of heroic hearts,
Made weak by time and fate, but strong in will
To strive, to seek, to find, and not to yield.
User avatar
Tanada
Site Admin
Site Admin
 
Posts: 17055
Joined: Thu 28 Apr 2005, 03:00:00
Location: South West shore Lake Erie, OH, USA

Re: The Curious Case of the Three Projections

Unread postby Ayoob » Thu 10 Apr 2014, 05:07:41

The only information I can add to this thread is my experience with the deputy Mayor of Los Angeles' response to my phone call about peak oil. I laid it out in a short blurb, and was probably too blunt about it. I can see why she fobbed me off. I should have been more patient and thought it through before the phone call.\

Nevertheless, here is a description of the exchange.

Hey, we're going to be running low on gas soon. What is the plan for the city of Los Angeles to deal with this impending crisis?

You should probably take the bus.

Ta-dah! Take the bus! And there you have it, right from the horse's mouth. Take the bus instead.

In a world of Horse and Canary Pie, the canary doesn't matter much.
User avatar
Ayoob
Expert
Expert
 
Posts: 1520
Joined: Thu 15 Jul 2004, 03:00:00

Re: The Curious Case of the Three Projections

Unread postby Pops » Thu 10 Apr 2014, 07:07:14

collapsenik wrote:So…does anyone know why?

It's probably the most honest prediction the EIAs put out since I've been watching. The extent of tight oil profitability isn't known. In fact the amount of unknown knowns aren't even known, LOL. How much of the production is hype and speculation and Exchange Traded Musical Chairs? How much is sustainable in the medium (let alone long) term when prices last fall were below $75 in N Dakota?
Then there is:
How long can you make a well?
How far can you frack rock?
How tight can you make the spacing?
Are there any other frackable source rocks?

There are a little over half a million wells in the US & the average production is 10bopd - in round numbers. So it is no surprise oilcos are excited to average 130bopd for a year or two.

The question is still, can they get that for a decade or two?
The legitimate object of government, is to do for a community of people, whatever they need to have done, but can not do, at all, or can not, so well do, for themselves -- in their separate, and individual capacities.
-- Abraham Lincoln, Fragment on Government (July 1, 1854)
User avatar
Pops
Elite
Elite
 
Posts: 19746
Joined: Sat 03 Apr 2004, 04:00:00
Location: QuikSac for a 6-Pac

Re: The Curious Case of the Three Projections

Unread postby ROCKMAN » Thu 10 Apr 2014, 08:12:05

Pops – ” The question is still, can they get that for a decade or two?” Which brings us again back to the same point: what is the basis for any projection? Folks can argue about a variety of aspects but there’s a critical one that can’t: how many locations (economic to drill or not) are there left in the known shale plays? Let’s just use the Eagle Ford Shale as the model. The extent of the EFS is known and has been known for decades. The extent of the oil window has been ID’d. And yes: future wells might be drilled on closer spacings. Which is just fine but regardless there is a finite number of locations to be drilled regardless of how optimistic the assumptions might be. Which means that every future EFS well, no matter how pie-in-the-sky the expectations might be, exists as a dot on a map.

So where is the map they are using to project future EFS production? The maps for the other shale plays? Without such a map it isn’t possible to predict future drilling activity and production. You cannot take a production curve and make any assumption about where it going in the future without knowing the physical limits of the play. In case the simplicity of this point escapes some folks: I have a room that’s 10’ X 10’. I send one person in the room every hour. After 10 hours my curve shows 10 people in the room increase at the rate of 1/hr. Now from that curve project how many will be in the room at the end of the next 10 hr period. Easy peazy…20. Now project forward 2 days. No problem…68. Getting a bit tight but OK. Now project forward 20 days from when I started filling the room: I should have 480 folks in that 100 sq ft room by then.

There is a physical limit, regardless of what a past performance curve indicates, to how many folks you can get into a defined space. And there is a physical limit to how many wells (and thus a production limit) can be drilled in a defined geologic trend.

Again, the Austin Chalk play in Texas is a great example: it was the hottest oil play on the planet in the 90’s. Much hotter than the EFS, Bakken or Marcellus. It is essentially a carbonate fractured shale that was horizontally drilled and frac’d. And just like the current shale plays had very impressive initial production rates with equally impressive decline rates. If one took the production curve of the AC by the late 90’s and projected it forward, even conservatively, we would be producing more oil from it today then the EFS and Bakken combined. But we aren’t and for a very good reason: like the EFS et al there was a physical limit to the productive extent of the AC. And for the most part the play was drilled up by 2000. There are still some AC wells being drilled today but way off from the boom times and much, much lower than any linear prediction from the 90’s would have produced.

I don’t have that map of the EFS extent. There are maps showing the extent of the geologic formation but that has to be reduced to focus upon the areas of potential commercial oil productivity. So back to the question: for anyone to a logical (and thus valid) projection of the future production of any geologic trend it must start with that map. The map, no matter how optimistic it is drawn, shows the physical limit of how many future wells might be drawn.

So have I missed the maps supporting all of those predictions? I don’t recall seeing one yet. For almost 4 decades I've listened to thousands of folks talk about the great potential of their drilling program. And none of those words meant anything to me until they showed me a map. Same thing with the shale play projections: show me a map with the future wells spotted (as optimistic as you like) and then we'll have the basis for a discussion. Until then it's a waste of time to speculate.
User avatar
ROCKMAN
Expert
Expert
 
Posts: 11397
Joined: Tue 27 May 2008, 03:00:00
Location: TEXAS

Re: The Curious Case of the Three Projections

Unread postby Pops » Thu 10 Apr 2014, 08:24:33

ROCKMAN wrote: Which brings us again back to the same point: what is the basis for any projection?

The EIA based its projections for years on a straight line increase in demand leading to a straight line increase in supply - as Kopits made the case, a demand based model.

I think it is notable that they even talk about supply constraints now.
The legitimate object of government, is to do for a community of people, whatever they need to have done, but can not do, at all, or can not, so well do, for themselves -- in their separate, and individual capacities.
-- Abraham Lincoln, Fragment on Government (July 1, 1854)
User avatar
Pops
Elite
Elite
 
Posts: 19746
Joined: Sat 03 Apr 2004, 04:00:00
Location: QuikSac for a 6-Pac

Re: The Curious Case of the Three Projections

Unread postby ROCKMAN » Thu 10 Apr 2014, 08:38:07

Pops - IOW the EIA economists think I could put 480 folks into that 10'X10' room as long as there is a sufficient supply of folks and a demand to stick them someplace. Makes sense to me. How could the plan not work: it shows right there on the chart: 480 in 20 days. LOL.
User avatar
ROCKMAN
Expert
Expert
 
Posts: 11397
Joined: Tue 27 May 2008, 03:00:00
Location: TEXAS

Re: The Curious Case of the Three Projections

Unread postby sparky » Thu 10 Apr 2014, 19:22:53

.
From a life time looking at graph projection , it seems painfully obvious that the data is woobly
such a big variation in the lines would indicate a wild card in the computation

the optimistic line got an upward inflexion around 2020 any idea what that would be ??
User avatar
sparky
Intermediate Crude
Intermediate Crude
 
Posts: 3587
Joined: Mon 09 Apr 2007, 03:00:00
Location: Sydney , OZ

Re: The Curious Case of the Three Projections

Unread postby ROCKMAN » Thu 10 Apr 2014, 20:55:35

Sparky - Perhaps a wild card like there might not be enough drill sites left to create the projected production. Don't want to belabor the point but the amount of wells left to drill (and the production from them) has zero relationship to the number of wells previously drilled. Except, of course, for those geologic trends that extend to infinity with an unlimited number of drill sites. So again let's forget the charts for a moment and ask to see a map with all those future drill sites spotted on it.
User avatar
ROCKMAN
Expert
Expert
 
Posts: 11397
Joined: Tue 27 May 2008, 03:00:00
Location: TEXAS

Re: The Curious Case of the Three Projections

Unread postby dcoyne78 » Thu 10 Apr 2014, 21:10:25

Hi Rockman,

If you know the area and number of wells per acre that is typically used couldn't you estimate the number of wells? Doesn't the USGS attempt to do this? Granted you don't really know what you'll get until the well is drilled and produced, at that point it is no longer a forecast it is a production report. We could use a time machine, but until someone comes up with one we just need to estimate. My estimate for the Eagle Ford is about 4 to 5 Gb and the USGS estimates 8 to 9 Gb for the ND Bakken/Three Forks. These could easily be off by 1 to 2 Gb high or low if prices remain in the 80-120 range.
dcoyne78
Coal
Coal
 
Posts: 476
Joined: Thu 30 May 2013, 19:45:15

Re: The Curious Case of the Three Projections

Unread postby collapsenik » Fri 11 Apr 2014, 07:42:53

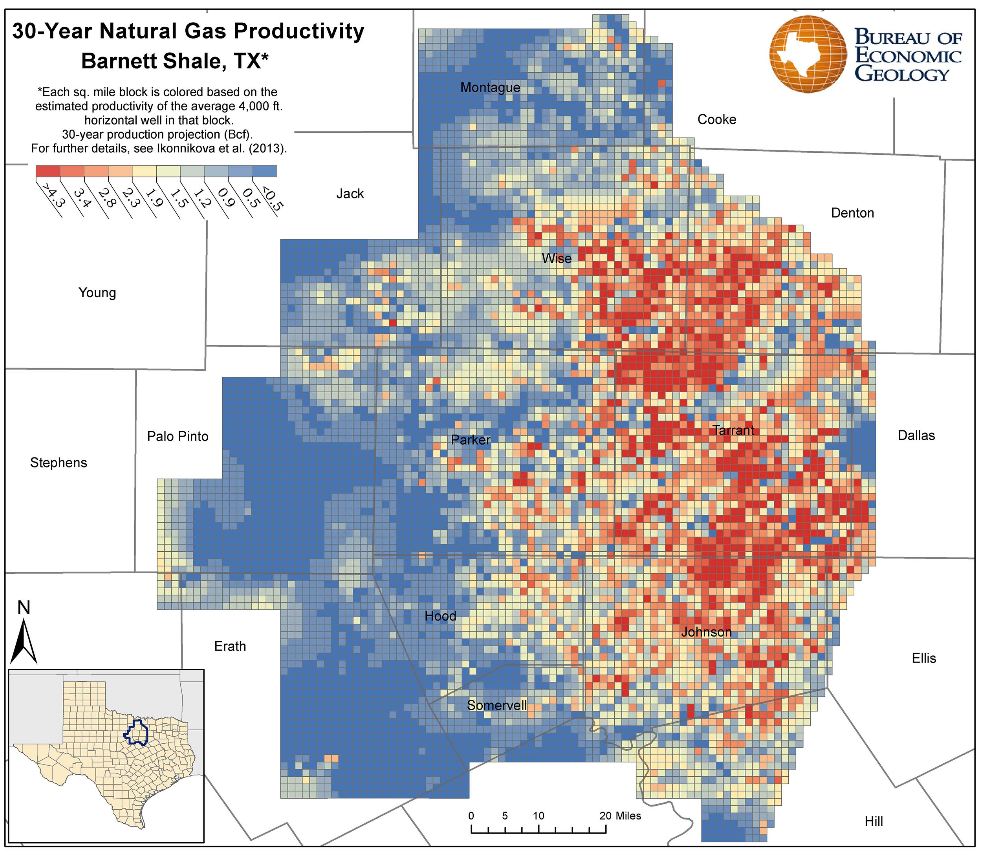
ROCKMAN wrote: Same thing with the shale play projections: show me a map with the future wells spotted (as optimistic as you like) and then we'll have the basis for a discussion. Until then it's a waste of time to speculate.


Like this one?

Image

I think the BEG is just finishing up one for the Haynesville and Fayetteville as well.

They think this shale stuff is pretty cool. Obviously, being in Texas and having two of them inside their borders probably helps.
collapsenik
Wood
Wood
 
Posts: 28
Joined: Sat 25 Jan 2014, 18:58:51

Re: The Curious Case of the Three Projections

Unread postby ROCKMAN » Fri 11 Apr 2014, 08:27:43

DC – And not to pick on the Survey since they are doing the best they can with limited resources. As you point out the best they can do is make some broad assumptions. And as C shows below the Texas Bureau of Economic Geology has a much better handle on the details. But look at the details on their map: Some of the blocks of greatest productivity are immediately offset by blocks of the lowest productivity.

Which gets to you point: it’s much easier to color code those blocks once the wells have been drilled. And that brings me back to my point: I’m not interested in seeing a map showing the productivity of specific areas after the wells have been drilled. I want to see the map showing the productivity of the undrilled areas…the future productivity as expressed in those charts predicting future production. The Barnett map is a good example of the problem. Imagine you build you historic production curve based upon the wells drilled on the right side of the map and then used that stat to predict productivity on the left side. As drilling has shown that “projection” would have missed by a wide margin.

Which is why my challenge to “show me the maps” is a bit of a red herring. The companies investing $billions in these plays have the best maps available. And they aren’t sharing. And guess what: sometimes the “best maps” aren’t all that good either. Just ask Shell Oil that recently walked away from Eagle Ford Shale leases they paid $1 billion for and then drilled 185 wells that had an INITIAL production rate average of 79 bopd. Sometimes even the “best maps” won’t create an accurate curve projection into the future. The BEG map also points out the obvious: all trends have a physical limit. Those dark blue patches aren’t areas where they haven’t drilled. They are areas where the play ceases to exist. All trends have physical limits regardless of anyone drawing a curve beyond that limit.
User avatar
ROCKMAN
Expert
Expert
 
Posts: 11397
Joined: Tue 27 May 2008, 03:00:00
Location: TEXAS

Re: The Curious Case of the Three Projections

Unread postby dcoyne78 » Fri 11 Apr 2014, 11:36:07

Hi Rockman,

Thanks. So the maps don't tell us much, we would only be guessing, that is kind of the definition of a forecast or prediction, no? :)

http://www.beg.utexas.edu/presentations ... %20Oil.pdf

At the Bureau of Economic Geology presentation above on slide 38 a 2010 forecast is shown and compared with production through 2013. See chart below.

shaleliquids.png


I also did my own scenario for US Tight Oil (LTO) based on a 10% annual discount rate and other reasonable economic assumptions with real oil prices rising from $100/barrel (in 2013$) in 2015 by 6% annually for the forseeable future. Note that this compares to an average annual rate of increase in real oil prices of 12% per year from 1998 to 2013.

ND Bakken Economically Recoverable Resources(ERR)=8.4 Gb, Eagle Ford ERR=4.5 Gb, and LTO other ERR=10 Gb where LTO other is all US LTO excluding the North Dakota Bakken/Three Forks and the Eagle Ford. Chart below

ltoscen.png
You do not have the required permissions to view the files attached to this post.
dcoyne78
Coal
Coal
 
Posts: 476
Joined: Thu 30 May 2013, 19:45:15


Return to Peak Oil Discussion

Who is online

Users browsing this forum: No registered users and 115 guests