

It's true that the recent price decline is not showing the same pattern as the prior year over year declines, but on the other hand, the prior declines, in percentage terms, were quite significant, i.e., year over year declines of 21% to 36%):
Major Year Over Year Declines in Annual Brent Crude Oil Prices since 1997:
1997 to 1998: $19 to $13 (Down 32%)
2000 to 2001: $29 to $24 (Down 21%)
2008 to 2009: $97 to $62 (Down 36%)
My point was, and is, the pattern of higher annual lows.
And the 2014 to 2015 decline appears to be the first comparable year over year decline (2013 to 2014 was down only 9%), so it remains to be seen if the average annual Brent crude oil price in 2015 is higher than the prior major decline level ($62 in 2009).
So, to recap, it's certainly true that we are not showing the higher lows pattern for any year over year decline, but there is a good chance that we will show the higher lows pattern for major year over declines, say 15% to 20% or more. Time will tell.
And to recap Lynch's prediction, the average annual Brent price for the five year period following his August, 2009 OpEd prediction was more than three times his predicted index price of the low 30's. In round numbers, Lynch predicted that the world would pay about $4 trillion for global Crude + Condensate (C+C) production for 2010 to 2014 inclusive, when we actually ended paying about $14 trillion (this is just for global C+C, the prices for refined petroleum products, inclusive of taxes, would be much higher).
But fundamentally, my difference with Lynch is over volumes, and I think that I am most closely associated with what I call "Net Export Math." Following is an excerpt from very brief January, 2006 essay on net oil exports:
http://www.theoildrum.com/node/984
January, 2006:
As predicted by Hubbert Linearization, two of the three top net oil exporters* are producing below their peak production level. The third country, Saudi Arabia, is probably on the verge of a permanent and irreversible decline. Both Russia and Saudi Arabia are probably going to show significant increases in consumption going forward. It would seem from this case that these factors could interact this year produce to an unprecedented--and probably permanent--net oil export crisis.
*At the time: Saudi Arabia, Russia & Norway
It's certainly true that Saudi Arabia and Russia's production did not exactly perform like I expected (and Saudi crude + condensate annual production has slightly exceeded their 2005 rate), but I did accurately predict a major inflection point in their net exports. Saudi net exports have been below their 2005 annual rate for eight straight years (and probably nine years). Russia's net exports stopped increasing in 2007, and have been at or below 7.2 mbpd since 2007. And as expected, Norway's net exports continued to decline.
At the time I wrote my essay on net exports, Saudi Arabia, Russia and Norway's combined net exports had increased from 15.2 mbpd in 2002 to 18.6 mbpd in 2005 (total petroleum liquids + other liquids, EIA). At this rate of increase, their combined net exports would have been up to about 23 mbpd in 2013, versus their actual rate of 17.5 mbpd, even as annual Brent crude oil prices doubled from $55 in 2005 to the $110 range in the 2011 to 2013 time frame.
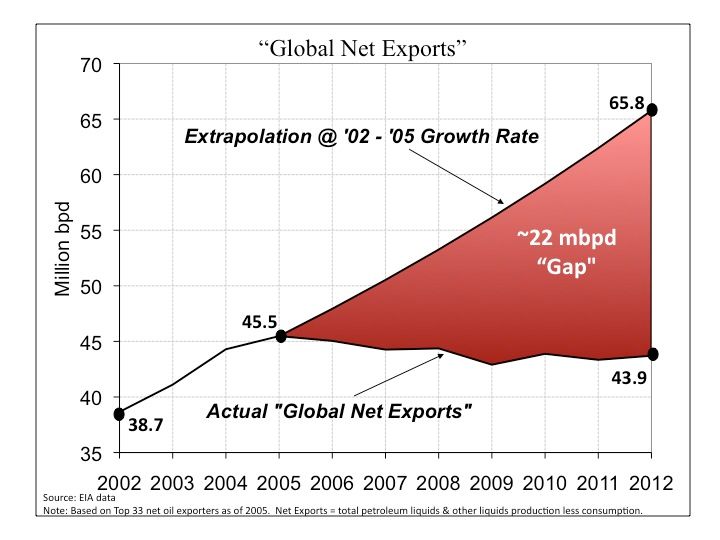
And we have seen a similar pattern in what I call GNE (combined net exports from the Top 33 net exporters in 2005). GNE were down to 43 mbpd in 2013, versus 46 mbpd in 2005:


 . Live and learn.


