Re: Global Crude Oil (45 or lower API gravity crude oil) ProductionIn my opinion it is very likely that actual global crude oil production (45 or lower API gravity crude oil) peaked in 2005, while global natural gas production and associated liquids, condensates & natural gas liquids (NGL's), have so far continued to increase.
As I have periodically noted, when we ask for the price of oil, we get the price of 45 or lower API gravity crude oil, but when we ask for the volume of oil, we get some combination of crude oil + condensate + NGL + biofuels + refinery gains.
Shouldn’t the price of an item relate to the quantity of the item being priced, not the item + (partial) substitutes?
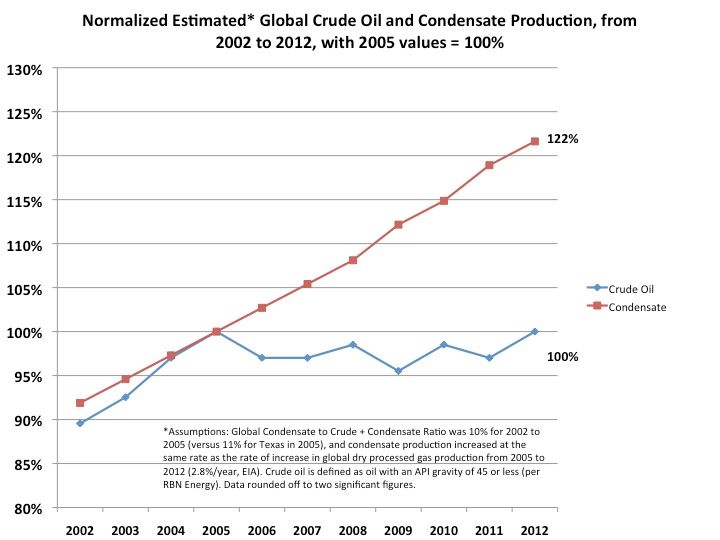
In any case, a key question is the ratio of global condensate to Crude + Condensate (C+C) production. Unfortunately, we don’t appear to have any global data on the Condensate/(C+C) Ratio. Insofar as I know, the only complete Condensate/(C+C) data base, from one agency, is the Texas RRC data base for Texas, which is shown below for 2005 and 2012:
2005:
Condensate: 0.12 mbpd
C+C: 1.08 mbpd
Condensate/(C+C) Ratio: 11.1%
2012:
0.30 mbpd
C+C: 1.95 mbpd
Condensate/(C+C) Ratio: 15.4%
The 2013 Ratio (more subject to revision than the 2012 data) shows that the ratio fell slightly, down to 14.7%, which probably reflects more focus on the crude oil prone areas in the Eagle Ford. But rounded off, we are looking at about 15% for 2012 and 2013.
The EIA shows that Texas marketed gas production increased at 5%/year from 2005 to 2012, versus a 13%/year rate of increase in Condensate production. So, Texas condensate production increased 2.6 times faster than Texas marketed gas production increased, from 2005 to 2012.
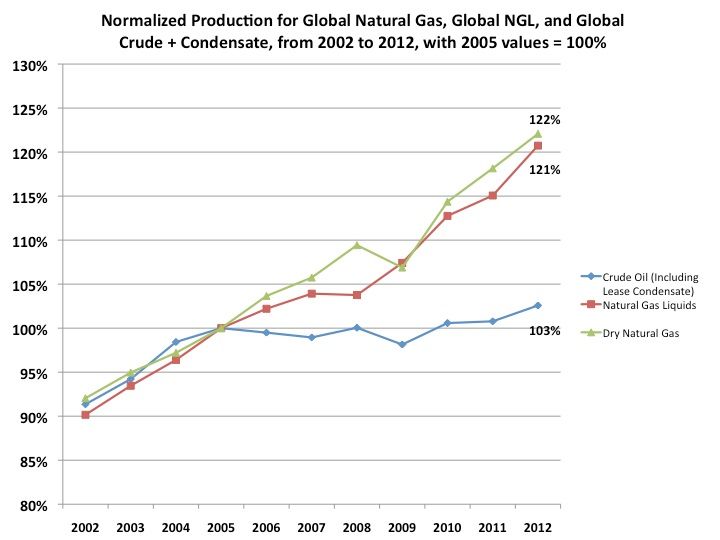
The EIA shows that global dry gas production increased at 2.8%/year from 2005 to 2012, a 22% increase in seven years. What we don’t know is by what percentage that global condensate production increased from 2005 to 2012. What we do know is that global C+C production increased at only 0.4%/year from 2005 to 2012. In my opinion, the only reasonable conclusion is that rising condensate production accounted for virtually all of the increase in global C+C production from 2005 to 2012, which implies that actual global crude oil production was flat to down from 2005 to 2012, as annual Brent crude oil prices doubled from $55 in 2005 to $112 in 2012.
Normalized global gas, NGL and C+C production from 2002 to 2012 (2005 values = 100%):
Estimated normalized global condensate and crude oil production from 2002 to 2012 (2005 values = 100%):
 Re: China's production
The EIA puts China's total petroleum liquids + other liquids (used for net import calculations) at 4.1 mbpd for 2010 to 2012, "Soaring" to 4.2 mbpd for 2013.
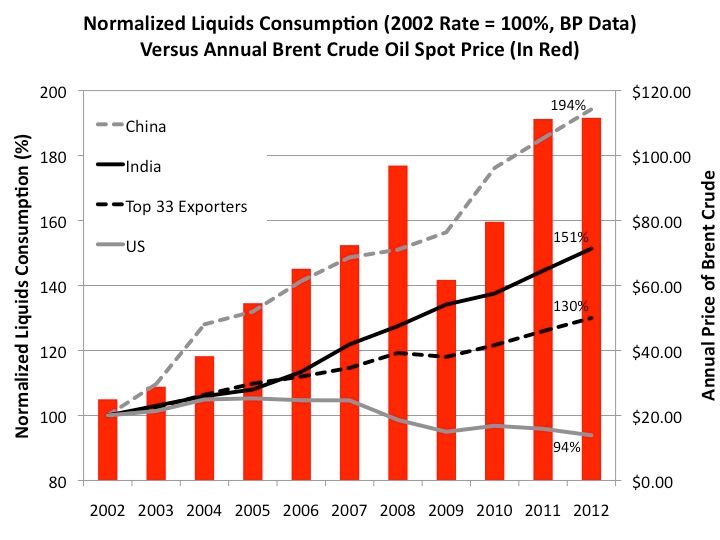
Re: Price VS. Consumption DataThe following chart shows normalized liquids consumption for China, India, (2005) Top 33 Net Oil Exporters and the US from 2002 to 2012, versus annual Brent crude oil prices. China's consumption in 2013 (per BP) was up to 204% of the 2002 rate, and the US was up slightly from 2012, to 96% of the 2002 rate.
 The $64 Trillion Question
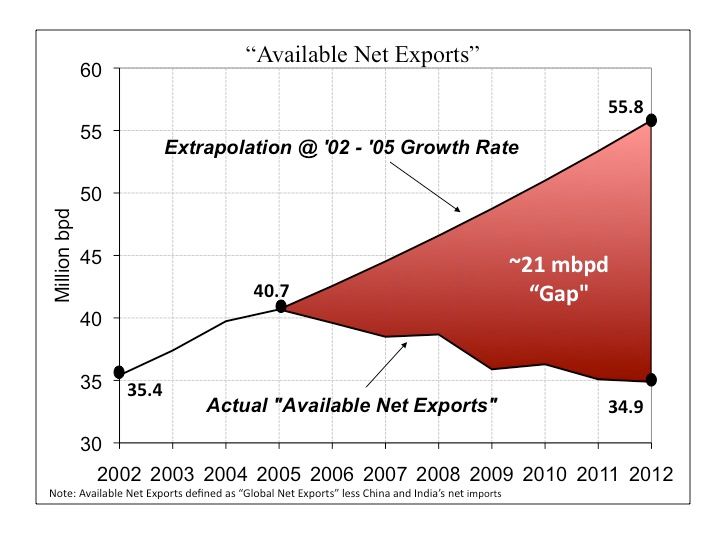
Production by the (2005) Top 33 net exporters was up slightly from 2005 to 2012, but their increasing consumption caused their net exports (what I call Global Net Exports of oil, or GNE) in 2012 to be below 2005, with a sizable rate of decline in their ECI Ratio (ratio of production to consumption).
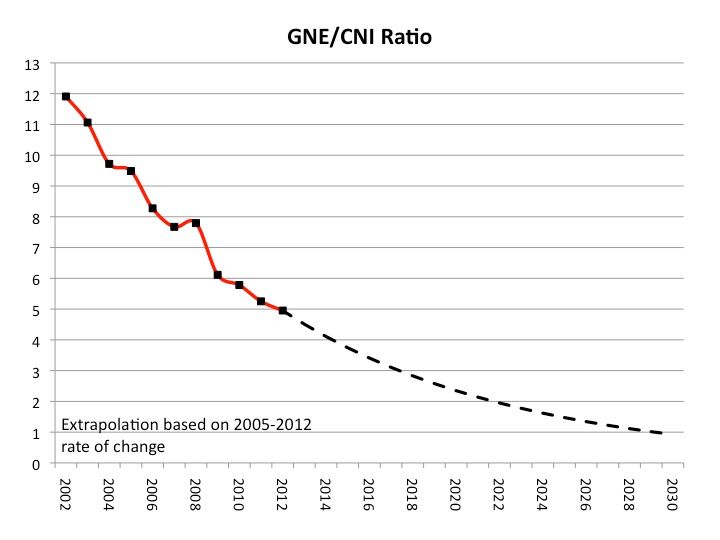
Furthermore, because of rapid increases in oil consumption by China & India (“Chindia”), what I define as Available Net Exports (ANE or GNE less Chindia’s Net Imports, or CNI) fell much more rapidly than GNE.
What happens from 2012 to 2022 is what I call the “$64 Trillion Question.”
Here are the 2012 values for the Top 33 net exporters in 2005, along with 2005 to 2012 rates of change (total petroleum liquids + other liquids, EIA, for net exports):
Production: 63 mbpd (+0.3%/year)
Consumption: 19 mbpd (+2.2%/year)
Net Exports: 44 mbpd (-0.5%/year)
Chindia’s Net Imports in 2012 and 2005 to 2012 rate of increase:
8.8 mbpd (+8.7%/year)
ANE (GNE less CNI) in 2012 and 2005 to 2012 rate of change:
35 mbpd (-2.3%/year)
If we assume that Top 33 production falls at 1.0%/year from 2012 to 2022 and if we assume that consumption continues to increase at the same rate (2.2%/year), GNE in 2022 would be down to 33 mbpd, almost a 3%/year rate of decline. Given this decline rate, unless Chindia’s consumption of GNE falls at 3%/year, or more, the resulting rate of decline in ANE will exceed the GNE decline rate, and the ANE decline rate will accelerate with time.
For example, let’s assume that Chindia’s rate of increase in net imports falls to 5%/year (versus 8.7%/year from 2005 to 2012). Their net imports in 2022 would be up to about 15 mbpd. ANE would be 33 (GNE) – 15 (CNI) = 18 mbpd (ANE), approximately a 50% reduction in the volume of Global Net Exports of oil available to about 155 net oil importing countries (versus 35 mbpd in 2012 and versus 41 mbpd in 2005). The 2012 to 2022 rate of decline in ANE would be 6.6%/year.
Re: Changes in demand for net imports in net oil importing countriesChina has shown a large increase in net oil imports in recent years, while the US has shown a large decline in net imports in recent years (due to a post-2005 decline in US consumption and due to temporarily rising US production). However, by definition changes in the demand for net imports in net oil importing countries have no direct impact on the
supply of Global Net Exports of oil (GNE), although changes in demand in net oil importing countries certainly do affect the
demand for GNE.
In any case, given that Brent has averaged around $110 for three straight years, demand for GNE remains high, and what the data show is that the developing countries, led by China, have been consuming an increasing share of a post-2005 declining volume of GNE. As noted above, the $64 trillion question is whether, and to what extent, that this pattern continues from 2012 to 2022 and in later years.


 In other words,