ralfy wrote:dashster wrote:
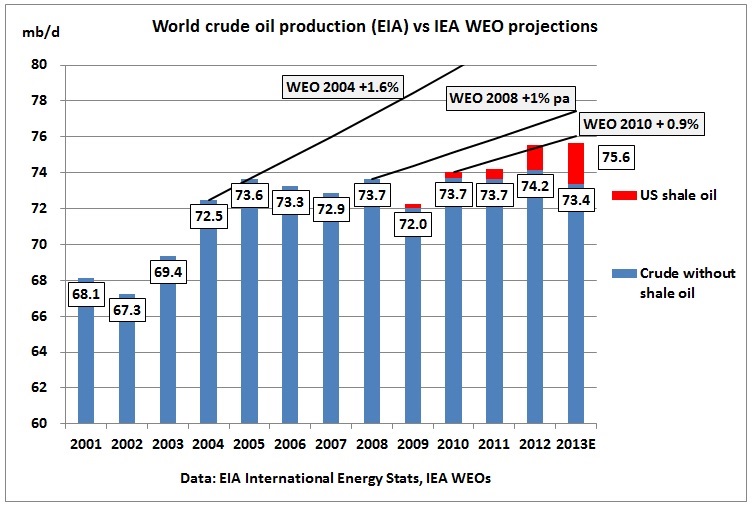
Looking at that graph, I don't know why people say conventional crude peaked in 2005 or 2008. That light grey area has two peaks higher and later than those two years.
I think the peak refers to an average shown in the second chart of this article:
http://crudeoilpeak.info/world-crude-pr ... 005-levels
They have this chart further down, which shows the average for every year, with 2012 at the top, but unfortunately, it looks like it includes tar sands.