@ rocdoc......I suspect you could be correct......I hope you are wrong.....but recent events certainly make me doubt the average intelligence of our species
it seems we are perhaps most highly motivated by the effect on our wallet


PeakOil is You
Desertification/Permanent Drying Out
Re: Desertification/Permanent Drying Out
![]() by kiwichick » Sat 19 Nov 2016, 05:52:46
by kiwichick » Sat 19 Nov 2016, 05:52:46
-

kiwichick - Intermediate Crude

- Posts: 2267
- Joined: Sat 02 Aug 2008, 03:00:00
- Location: Southland New Zealand
Re: Desertification/Permanent Drying Out
![]() by dohboi » Sun 20 Nov 2016, 23:05:20
by dohboi » Sun 20 Nov 2016, 23:05:20
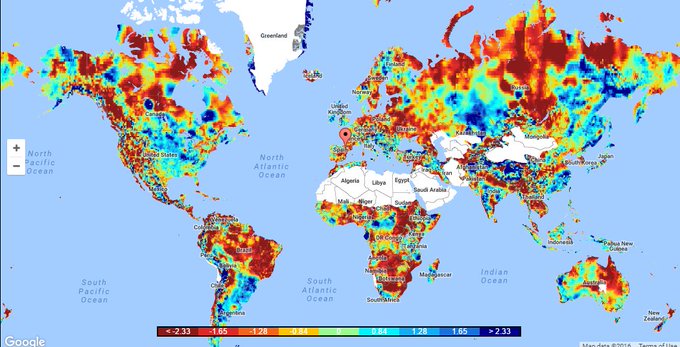
The past four years has seen mostof the terrestrial earth drying out:
https://twitter.com/robertscribbler/sta ... wsrc%5Etfw
https://twitter.com/robertscribbler/sta ... wsrc%5Etfw
-
dohboi - Harmless Drudge
- Posts: 19990
- Joined: Mon 05 Dec 2005, 04:00:00
Re: Desertification/Permanent Drying Out
![]() by kiwichick » Mon 21 Nov 2016, 04:54:47
by kiwichick » Mon 21 Nov 2016, 04:54:47
@ pstarr...got a link showing why the map is wrong?
-
kiwichick - Intermediate Crude
- Posts: 2267
- Joined: Sat 02 Aug 2008, 03:00:00
- Location: Southland New Zealand
Re: Desertification/Permanent Drying Out
![]() by vtsnowedin » Mon 21 Nov 2016, 13:40:08
by vtsnowedin » Mon 21 Nov 2016, 13:40:08
pstarr wrote:It's out of date. I can tell because California is awash in blessed rain but the map shows red.
It will take a lot more rain to end it. One of the better tools to monitor the conditions is the water levels in the reservoirs.
http://cdec.water.ca.gov/cdecapp/resapp ... ain.action
-
vtsnowedin - Fusion

- Posts: 14897
- Joined: Fri 11 Jul 2008, 03:00:00
Re: Desertification/Permanent Drying Out
![]() by vtsnowedin » Mon 21 Nov 2016, 16:56:06
by vtsnowedin » Mon 21 Nov 2016, 16:56:06
pstarr wrote:vt, I introduced the club to cdec, and I know how to use it. You need to look to historical data to understand reservoir levels. Here is a link cdec storage at Shasta
The current chart shows an exceedingly rainy Oct/November, and reservoirs that have remained relatively full from the previous abundant rain year. In fact only two previous years since 2007 exceeded this early high storage level.
vt, your chart compares current storage to an entire historical storage year. Of course the reservoirs are not full now. The rain year just started. We are just coming off the very end of the the previous seasons dry period. When levels are always low. But the levels in the chart you posted are actually incredibly high . . . for the date.
I might be mistaken but I am under the impression that the orange line average level changes with the day of the year. Near full in spring and much lower at the end of September after the end of the summer irrigation season.
-
vtsnowedin - Fusion
- Posts: 14897
- Joined: Fri 11 Jul 2008, 03:00:00
Re: Desertification/Permanent Drying Out
![]() by vtsnowedin » Mon 21 Nov 2016, 17:34:20
by vtsnowedin » Mon 21 Nov 2016, 17:34:20
pstarr wrote:You are correct vt, its says on the key for the chart: "Red Line: Historic level for date." Could be early releases for fall salmon runs?
Last winter Shasta got as full as they let it get (flood reserve space) but none of the others made it to full and many in the south stayed well below normal. They have a good start this fall and April one might look better then it has for several years. Here is hoping!
-
vtsnowedin - Fusion
- Posts: 14897
- Joined: Fri 11 Jul 2008, 03:00:00
Re: Desertification/Permanent Drying Out
![]() by dohboi » Mon 21 Nov 2016, 22:28:52
by dohboi » Mon 21 Nov 2016, 22:28:52
Water rationing introduced as Bolivia drought worsens
Water rationing becomes permanent in La Paz as the dams run dry.
http://www.aljazeera.com/news/2016/11/w ... 20654.html
Water rationing becomes permanent in La Paz as the dams run dry.
http://www.aljazeera.com/news/2016/11/w ... 20654.html
-
dohboi - Harmless Drudge
- Posts: 19990
- Joined: Mon 05 Dec 2005, 04:00:00
Re: Desertification/Permanent Drying Out
![]() by dohboi » Sun 20 Aug 2017, 17:38:58
by dohboi » Sun 20 Aug 2017, 17:38:58
https://www.theguardian.com/environment ... completely
Tagus river at risk of drying up completely
Climate change, dams and diversion bring Iberian peninsula’s longest river, on which millions depend, to brink of collapse
Tagus river at risk of drying up completely
Climate change, dams and diversion bring Iberian peninsula’s longest river, on which millions depend, to brink of collapse
-
dohboi - Harmless Drudge
- Posts: 19990
- Joined: Mon 05 Dec 2005, 04:00:00
Return to Environment, Weather & Climate
Who is online
Users browsing this forum: No registered users and 106 guests