Peak Oil is You

Donate Bitcoins ;-) or Paypal :-)
Page added on July 29, 2016
State Of The Oil Market
Summary
US production decline is accelerating and not as resilient as initially purported.
The global oil market is now undersupplied.
Based on current US rig count, the global oil market will be significantly more undersupplied by 3Q17 than it was oversupplied in 2Q15 (2.2 MMbopd) when OPEC flooded the market.
Production from “tight” source rock is a game changer
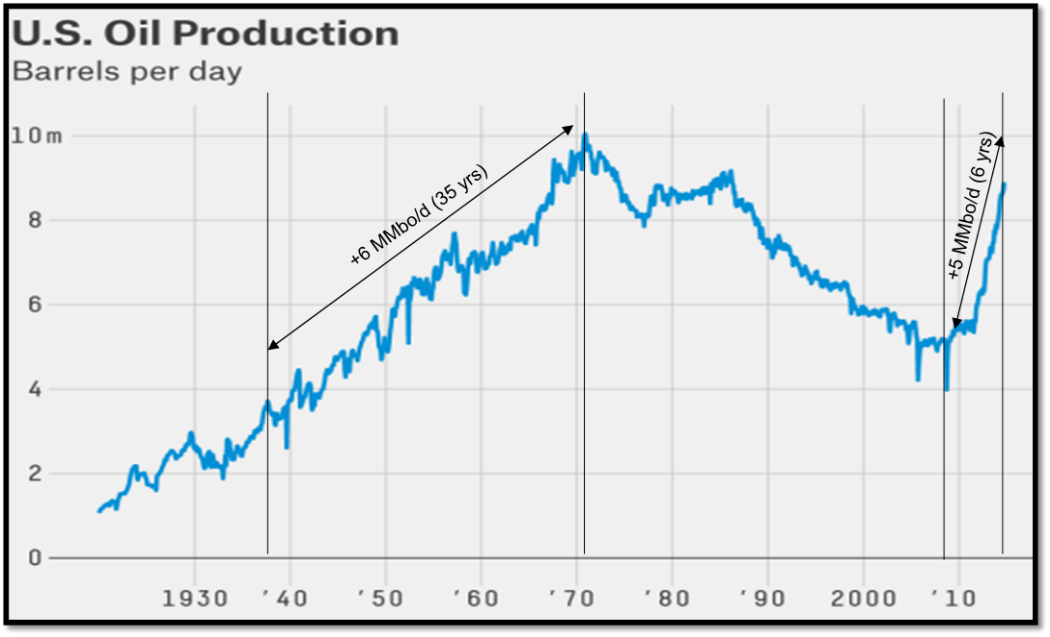
Over the 35-year period from 1937 to 1972, US oil production increased 6 MMbo/d, primarily from conventional sources, and then declined 5 MMbo/d over the next 38 years, resulting in the USA’s unhealthy dependence on imported oil, the rise and fall of a well-functioning cartel, $100+ oil, fear of Peak Oil, and T. Boone Pickens’ famous prediction/warning a decade ago of the “possibility for the greatest wealth transfer in the history of mankind”. The commercial development of “tight” oil shale, starting with the Bakken, changed everything and has put the US on the path to energy independence, as US oil production almost doubled from 2009 to 2014. This rate of growth is unparalleled and not even the discovery of the 100+ billion barrel mega-giant oil field “Ghawar” in Saudi Arabia in 1948 can match it.
OPEC has not always been in disarray
The last time you could buy a gallon of gasoline for ~$0.70 / gallon was 1997-1998. During that 2-year period, Saudi intentionally flooded the market, primarily to punish other OPEC members for not adhering to quotas, and drove oil prices all the way down to a bottom of $10.82/bbl on December 10, 1998. After enduring two years of pain, the rest of OPEC essentially said “no mas,” we will do whatever you like Saudi and the “price band mechanism” was adopted in 1999. The initial band was $22/bbl to $26/bbl whereby OPEC removed supply when oil prices fell below $22/bbl and added supply when oil prices exceeded $26/bbl. Later, OPEC moved the band higher with the official floor reaching $80/bbl at one point before doing away with it altogether.
The “price fixing” strategy worked like a charm, as oil prices were below what OPEC/Saudi deemed “fair” less than 5% of the time over the 15-year period from 1999 to 2014. The first real test of the price band mechanism policy was the 2001-2002 recession related to technology fueled “dot-com” bubble burst. During the midst of this recession, oil prices fell below the $22/bbl floor to ~$17.50/bbl on November 15, 2001, and Saudi/OPEC, along with cooperation from Mexico and Norway, agreed to a coordinated production cut and ultimately pushed oil prices back above the $22/bbl floor on March 1, 2002. The second and even greater test was the “Great Recession” in 2008-2010. When the global banking system started to implode and financial markets collapsed in 2H08, global oil demand decreased 3 MMbopd seemingly overnight and oil prices fell from a high of $145.31 on July 14, 2008 to a bottom of $30.28/bbl on December 23, 2008. OPEC responded with a massive cut to its combined quota of 4 MMbopd (actual cut was 3MMbopd as they always cheat), balancing the market, sending oil prices back above $50/bbl within 3 months, and leaving little doubt that OPEC/Saudi was firmly in charge of the global crude oil market.
OPEC/Saudi had a change of heart on Thanksgiving Day 2014
OPEC/Saudi officially abandoned its successful “price fixing” strategy on Thanksgiving Day 2014. Market share and geopolitics, especially over control of the Middle East, are the two main factors cited in this decision. I believe a third factor may have been that OPEC/Saudi realized it did not have the capacity to deliver 1+MMbopd in annual oil production growth to meet global oil demand growth over the next decade or so and its role as the global swing producer was coming to an end and likely to be replaced by US tight oil production. Regardless, the cartel is now in disarray and a return to price manipulation seems unlikely. There has also been a lot of discussion in the media and from the Saudis about a potential IPO of Saudi Aramco. If true, I give the Saudis little chance of success, as a price-fixing business model violates US anti-trust laws. I would also guess that any class action oriented litigator, who understands OPEC’s manipulation of oil prices since 1999, is licking their chops at the prospect of Saudi Aramco trading on the NYSE.
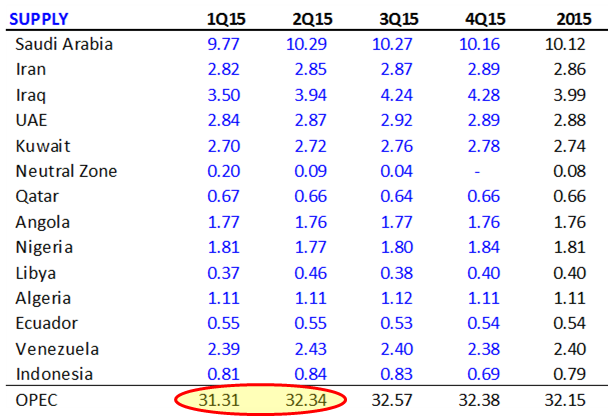
Saudi and Iraq add fuel to the fire and flood the oil market 2Q15
With the decision to quit price fixing on Thanksgiving Day 2014, OPEC/Saudi essentially stripped the “free put” it provided to other producers and allowed the global oil market to remain oversupplied (i.e., 1.2 MMbopd in 4Q14) going into 2015. This action caused OECD total petroleum inventories (i.e., oil, gasoline, distillates, etc.) to rise dramatically in 1Q15 and oil prices to crash to $43.39/bbl on March 17, 2015. Fortunately, oil demand, despite the persistent bearish narrative related to “forecasts” from the IEA and others and not from “actual” data, was overwhelmingly strong, and oil prices recovered to $61.36 on June 10, 2015. OPEC (primarily Saudi and Iraq) responded by adding an additional 1 MMbopd in 2Q15, effectively increasing global oversupply to ~2.2 MMbopd. This action poured fuel on the fire by sending OECD total petroleum inventories through the roof in 2H15 and bringing the nascent oil rally to a swift end. The fallout and collateral damage included more bankruptcies, layoffs, and massive capital destruction for individuals and financial institutions.
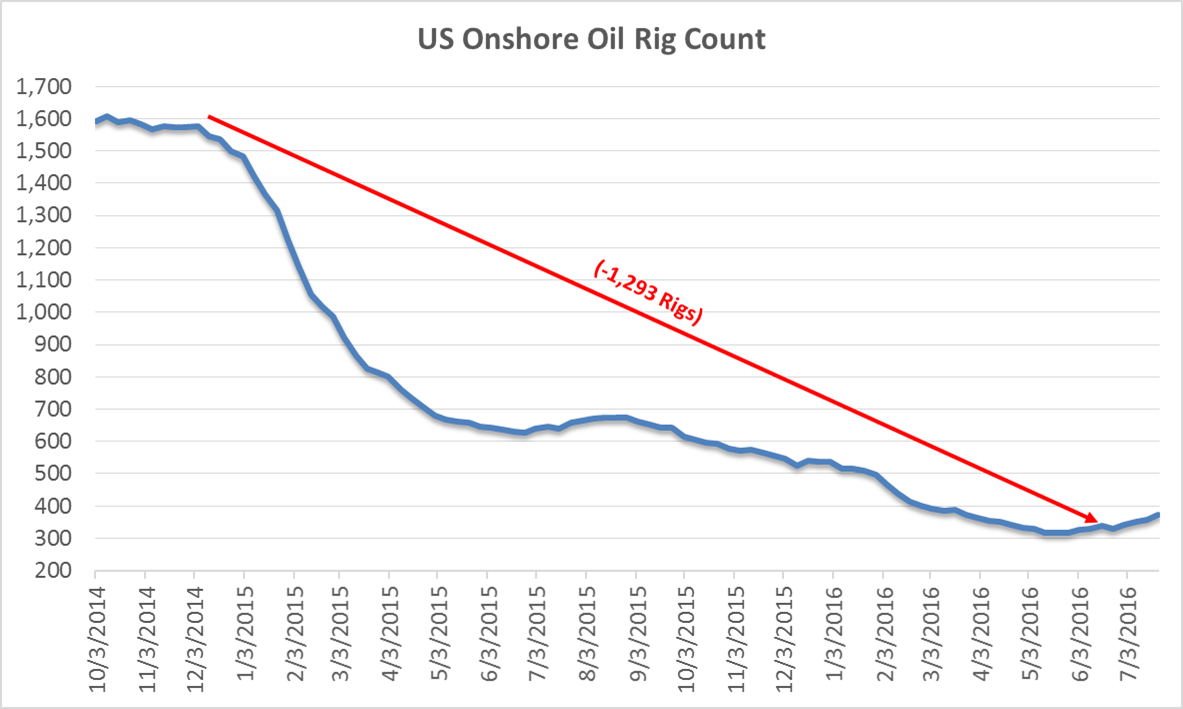
The most bullish catalyst underpinning oil prices has been the decline in US oil production
From peak to trough, the US oil directed rig count fell 1293 rigs, but because of efficiency gains related to drilling best prospects with best rigs/crews, US oil production did not roll over and even continued to climb into 2Q15.
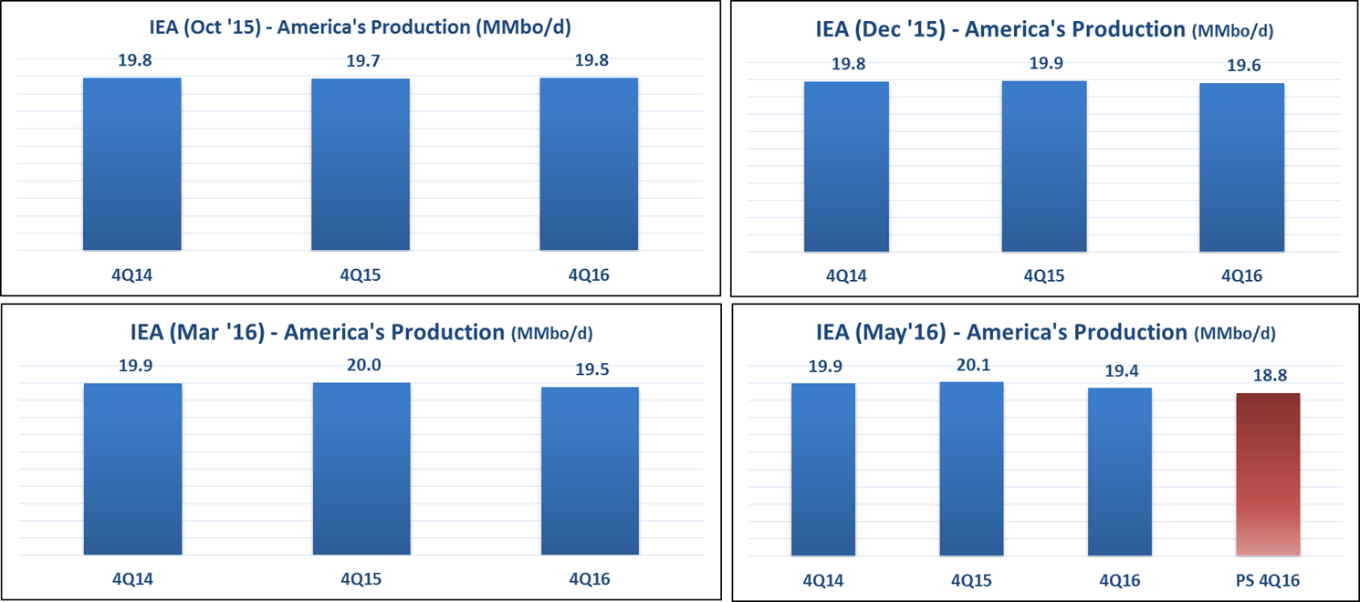
The market, IEA, EIA, most analysts, and press remained mystified at the “resiliency” in US production and the fact that it did not decline as quickly as the rig count. For example, the IEA in its October 2015 Oil Market Report (“OMR”) showed that Americas (USA, Canada, Mexico, and Chile) production would not decrease over the 2-year period from 4Q14 to 4Q16. How is this even possible with the collapse in the US oil rig count?? This forecast obviously made little sense and somewhat indicated the IEA lacked the tools to model unconventional tight oil production. Since then, the IEA has begun a series of downward revisions, culminating with a 500 Mbopd decline in the May 2016 OMR. Based on a belief the IEA’s methodology was flawed, I have modeled (see appendix for detailed modeling assumptions) the four major US tight oil shale basins — the Permian, Eagleford, Bakken, and Niobrara — and this analysis indicates the IEA is not even close, and we should see another 600 Mbopd of downward revisions in future OMR’s based on the current US oil rig count.
Finally and for the record, there was nothing particularly mystifying about the “resiliency” in US production, as US tight oil production is actually following a fairly predictable pattern not too dissimilar from what we have observed in other “tight” rock/shale plays. When we see a collapse in commodity prices and a dramatic fall in rig count, production typically peaks 6 to 18 months afterwards, rolls over slowly, and then, when efficiency gains reach their limitations, goes over the edge and falls precipitously.
The Haynesville may give us a clue
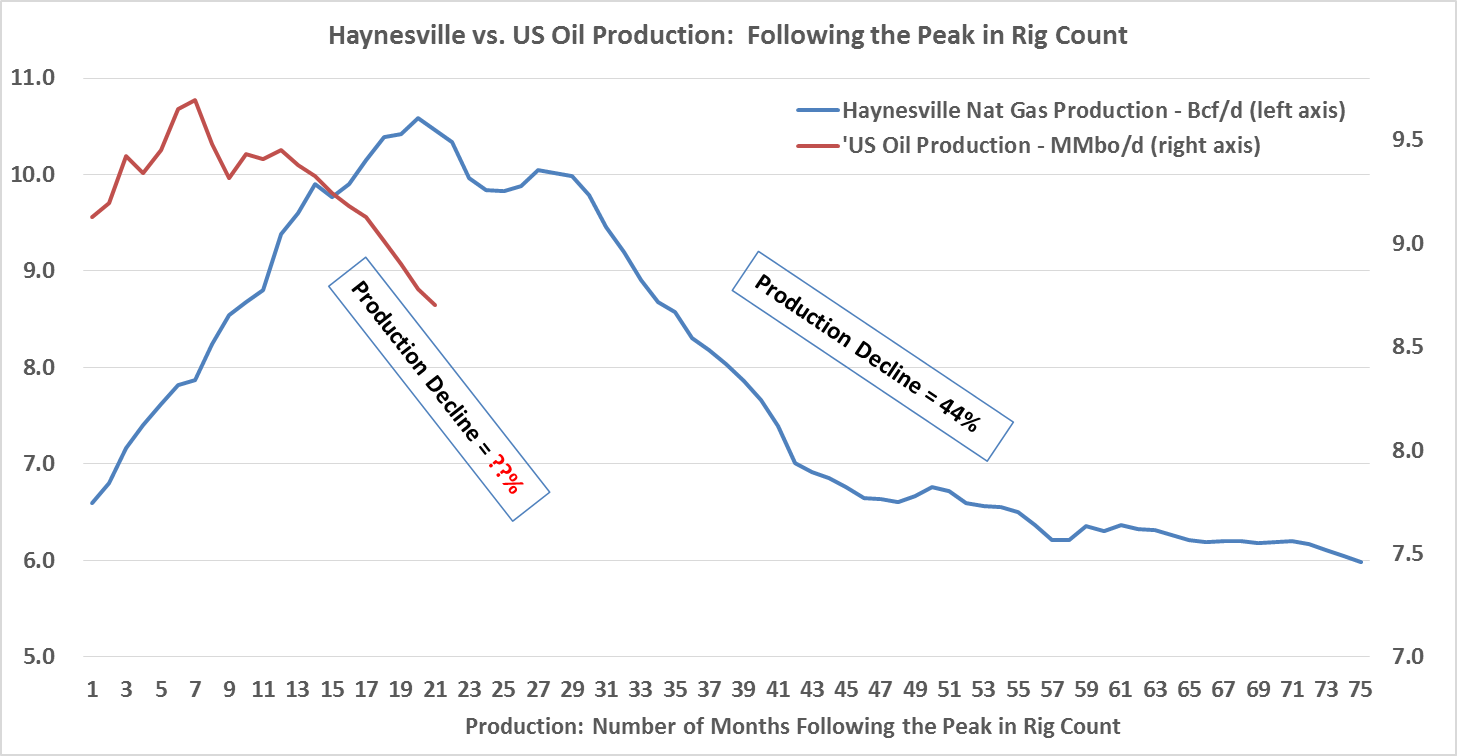
The Haynesville gives us a clue about how to think about efficiency gains and the relationship between rigs, production, and high decline rates from wells drilled into “tight” source rocks. In the Haynesville, the rig count decreased 80% from 240 to 48 in 26 months, while natural gas production peaked 18 months after the rig count peaked and ultimately, over the next 25 months, decreased 44% to ~6 Bcf/d from its peak. Note the acceleration in monthly production declines ~26 months after the 2nd peak in rig count — once production goes over the cliff and begins the rapid phase of its descent, the slope of the decline in natural gas production is almost as steep as the slope of the decline in the rig count ~26 months earlier.

Deja Vu – The behavior of US tight oil production is similar to Haynesville tight gas production
As a result of the collapse in US natural gas prices in 2010, the rig count in the Haynesville began to collapse that year and ultimately decreased 94% to 48 rigs over a 30-month period. By comparison, the US oil rig count has collapsed 77% to 371 rigs over the 21-month period from October 2014 to July 2016. Also note, that even though the fall in the US oil rig count was compressed relative to the fall in the Haynesville rig count, they both had a brief period where the rig count declines flat lined and modestly ticked up before resuming their steep declines.

Because the US oil directed rig count fell relatively faster than the Haynesville rig count, US oil production peaked in 6 months following the peak in the US oil rig count, compared to 18 months for the Haynesville, and then declined modestly over the next 12 months. Production declines are now starting to accelerate. To put this in perspective, of the 1.2 MMbopd decline in US crude production, roughly half occurred in the last three months (i.e., 2Q16). More importantly, US oil production has only declined 13% so far from its peak. If the Haynesville is a proxy for US oil production and it declined 44% from its peak, then let’s just say we have a long way to go in the decline of US oil production based on the current rig count.
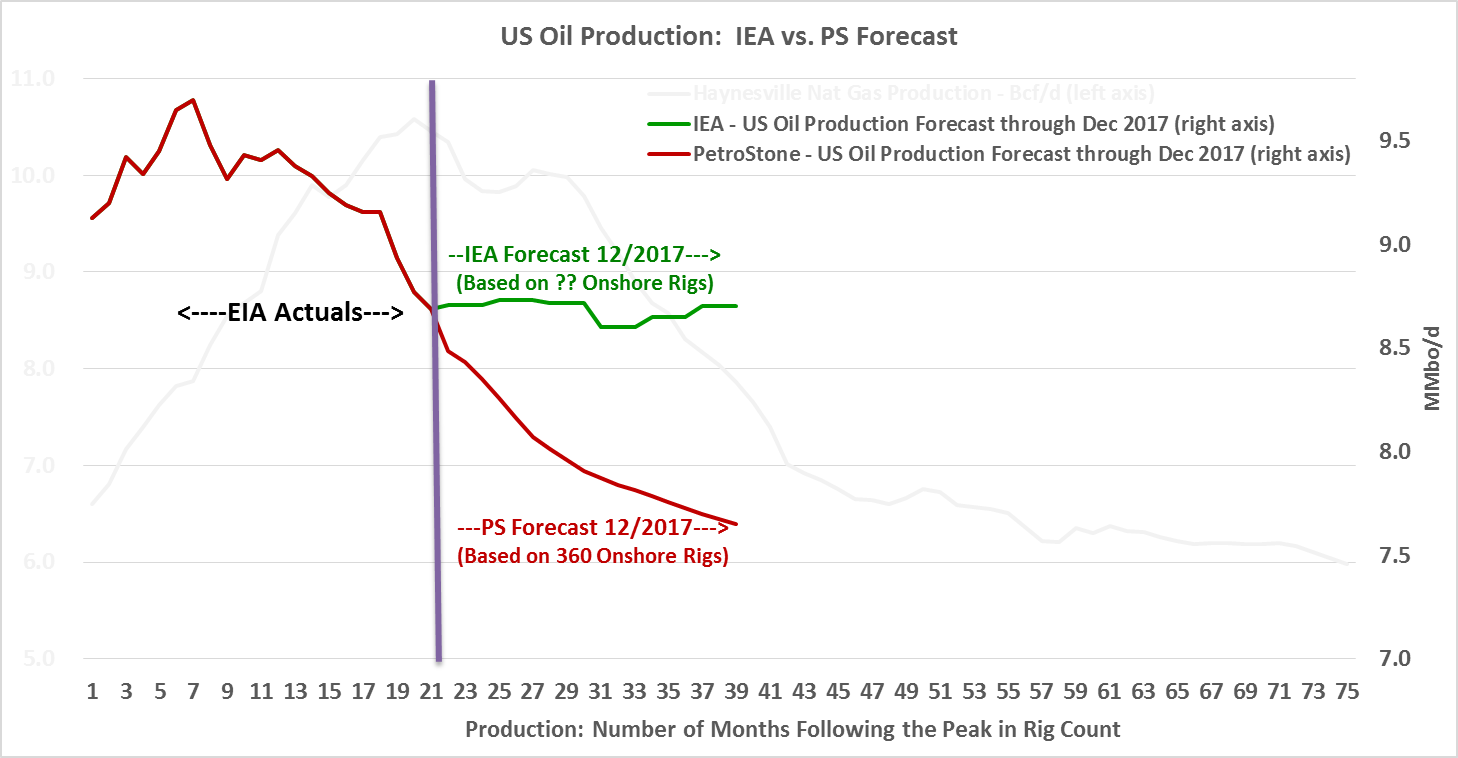
The IEA rolled out its 2017 forecast for “Americas” production in June 2016 – does it make sense?
A picture is worth a thousand words. Below is the prior chart updated with the IEA forecast through 2017. As you can see, there is a sudden and inexplicable cessation in the decline of US oil production in July 2016. How would this even be possible without an immediate and material increase in oil prices? That said, the baseline model, based on 370 onshore oil rigs, shows US oil production will continue to fall to 7.65 MMbopd through December 2017. I would also like to emphasize the shape of the US oil production curve (“Production: Number of Months Following the Peak in Rig Count”) looks somewhat similar to the shape of the Haynesville production curve (“Production: Number of Months Following the Peak in Rig Count”).
The global oil market is in uncharted waters
The US, if indeed it is poised to become the global swing producer, needs to deliver 1+MMbopd in annual production growth over the next decade. That is easier said than done and probably not possible anywhere else on the globe. To actually deliver 1+ MMbopd of annual production growth, I think US Oil & Gas companies will have to initially deploy an average of 900 rigs. This level of activity is problematic in that it requires a massive amount of equipment, labor, training, capital, and a sustained period of much higher oil prices. Ask yourself: If you were an Oil & Gas executive and your company had either been to the brink or unfortunately over it, would you rush out to deploy 900 rigs the first time you see $70/bbl oil and lever up your balance sheet in the process? Probably not, at least not immediately. My guess is US Oil & Gas executives, afraid of the “eventual” return to $26/bbl, will (i) use excess cash flow to pay down debt, (ii) issue equity to pay down debt (iii) refinance and term out RBL’s/High Yield maturities when and if capital markets reopen and (iv) sell assets at significantly higher values relative to the last two years to pay down debt. After all, these executives will be nervous that oil is heading back to $26/bbl, and will feel compelled to fortify their balance sheets accordingly. I would even take it a little further and throw out there that this level of activity will only occur with a change in the psychology of US Oil & Gas executives that $70/bbl and not $40/bbl is the correct oil price for medium to long-term planning. The problem is this will not happen overnight, which makes my baseline forecast or something close to it more probable.
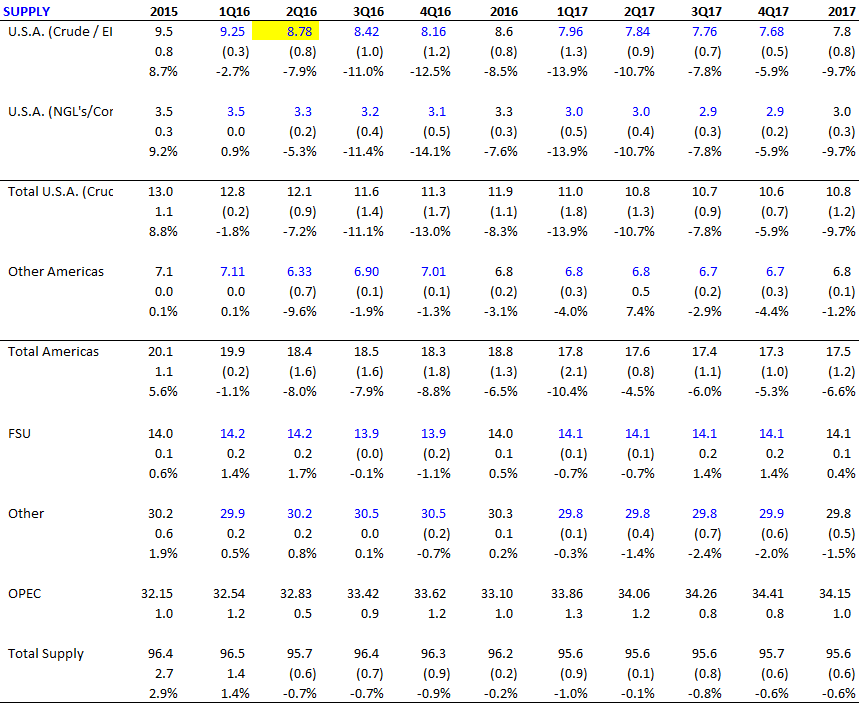
US oil production may be ~1 MMbopd less than market expectations in 2017
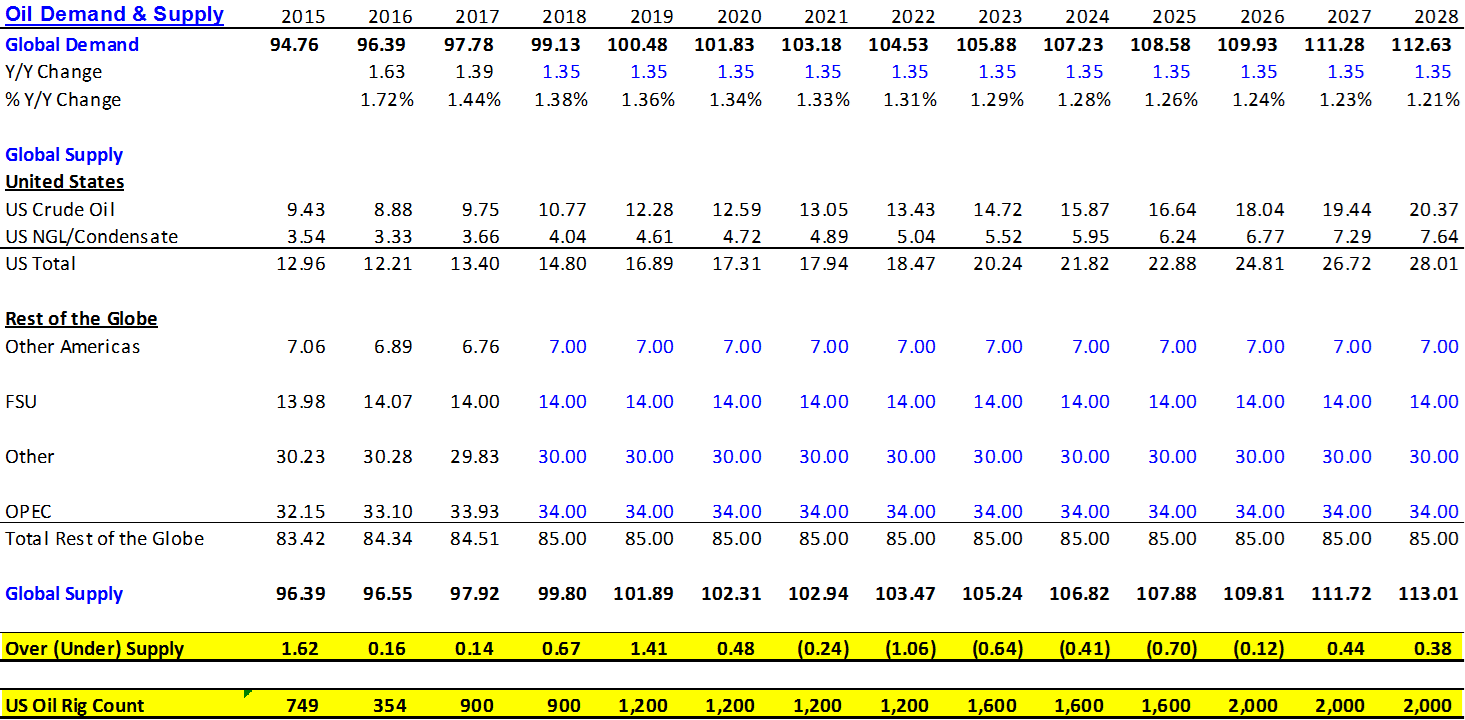
Below is my baseline supply model that reflects current oil prices and 370 oil rigs (371 current). The main takeaway should be US oil production in 2017 will be approximately 1 MMbopd less than what the IEA is forecasting. I would also like to point out that the IEA only forecasts “Americas” production through 4Q17, so I have had to estimate the IEA’s US crude oil production forecast.
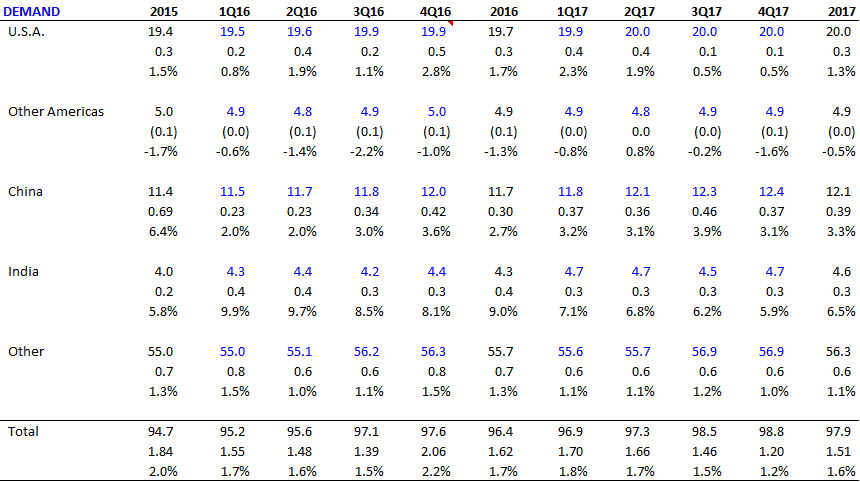
Below is my baseline demand model. I could, but will not go into a long diatribe about the IEA’s consistent underestimation of demand, but will point out the IEA revised its 2015 global oil demand forecast up at least 6 times and Chinese oil demand forecast up at least 8 times. In fact, there has been a pattern over the last two years in which the IEA’s demand and supply forecasts start off “bearish” only to be followed by a series of bullish revisions. And, based on the June 2016 OMR, I expect a continuation of this pattern. I’m not a statistician, but shouldn’t upward and downward revisions on the balance cancel each other out? Finally, because the market, press, etc. have focused more on bearish demand “forecasts”, there seems to have been little notice and/or discussion about the incredibly bullish demand that “actually” occurred. For example, 2015 annual global oil demand grew 1.85 MMbopd, dramatically exceeding expectations of 0.91 MMbopd published by the IEA in its January 2015 OMR. Similarly, Chinese 2015 annual global oil demand increased 0.7 MMbopd, compared to expectations of 0.3 MMbopd published by the IEA in its January 2015 OMR. Accordingly, I have modeled demand growth to be a little more aggressive in 2016 and 2017 than the IEA, but less than actual oil demand growth in 2015.
The baseline oil balance model isn’t pretty
Below is my baseline supply/demand balance model. As you can see, the model indicates the global oil market is undersupplied 0.7 MMbopd in 3Q16 and more importantly the undersupplied oil market will grow to 3.1 MMbopd by 4Q17 without a material increase in rig count. Remember, the most the oil market was ever oversupplied was 2.2 MMbopd in 2Q15 when Saudi and Iraq flooded the market.

If 900 rigs balances the market over the next 3 years, what happens after that?
The answer is an average of 900 rigs, drilling ~1-mile laterals, can increase and then hold US oil production relatively flat at ~11 MMbopd, but at that point US oil production will be on a treadmill and 900 rigs, drilling continuously and approximately 11,000 new wells per year, will merely offset base decline. Moreover, after adjusting for efficiency loses related to adding more rigs/crews and drilling non-core prospects, I forecast (i) 1,200 rigs can increase US oil production and hold it flat at ~14 MMbopd, (ii) 1,600 rigs can increase US oil production and hold it flat at ~17 MMbopd, and (iii) 2,000 rigs can increase US oil production and hold it flat at ~21 MMbopd. This is important because the US will likely need to more than double crude production in the next decade to meet global oil demand growth. Below is a chart/table that show my forecasts for US oil production and rig count required to balance the global crude oil market.

Summary
The 15-year run of a successful price fixing cartel has come to an end and the US is now the global swing producer.
US oil production decline is accelerating and not as resilient as initially purported.
The global oil market is now undersupplied and OECD petroleum inventories have begun their descent and the pace will accelerate without a material increase in the US oil rig count.
In particular, if the US oil rig count remains anywhere near 370 rigs, it will be a disaster next year and create a global oil market that will be significantly more undersupplied than it was ever oversupplied in 2Q15 when OPEC flooded the market.
Since the above is unlikely to happen, US oil companies will eventually deploy a sufficient number of rigs (i.e., ~900 rigs) to balance the global crude oil market, but this will only happen with conviction that oil prices closer to $70 and not $40 are sustainable.
Longer term, the US will find itself on a treadmill and there should be a steady progression to 2,000 rigs.
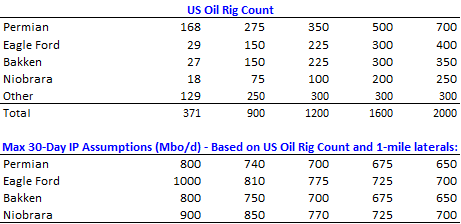
Model Assumptions
30-day cycle time (spud to 1st production): 1 well per rig per month to build a drilling location (ii) drill a well remove drilling equipment (iv) frac the well with 25-50 stages drill out frac plugs (vi) complete flowback (vii) hook up to sales/tie-in (viii) recover frac water to reach 30-day max IP. Please note the reality is the cycle time for a new well is closer to 40 days and for a drilled uncompleted well (“DUC”) closer to 25 days, so my 30-day assumption on average should prove conservative. Finally, while I’m assuming 1 well/rig/month (i.e., 900 rigs = 10,800 wells per year), the number of new wells online in a given period of time will also be dependent on frac spreads and other equipment needed to make wells ready for production as well as average lateral lengths and pad drilling.
Oil decline curve parameters for the Permian, Eagleford, Bakken, and Niobrara: Di – 72.5% & b-factor – 1.18
US Oil Rig Count and Efficiency Gain/Losses on Max 30-Day IP:
One Comment on "State Of The Oil Market"
Roger on Fri, 29th Jul 2016 9:45 pm
Nice article! Your forecasts look more credible to me than the EIA’s propaganda. That said, there is one area I don’t buy into:
“US oil companies will eventually deploy a sufficient number of rigs (i.e., ~900 rigs) to balance the global crude oil market, but this will only happen with conviction that oil prices closer to $70 and not $40 are sustainable.”
Art Berman’s break-even price analyses for various basins/plays leads me to suspect it will take much more than $70/BO to get the rig count to 900….and unfortunately, by the time we actually get there, l suspect rather than running on a “treadmill” we’ll be swimming up a “waterfall” …I.e., adding rigs as quickly as possible while the supply/demand gap continues to grow. The future for US O&G is bright, but I’m highly skeptical we can act as the world’s “swing producer.”