Peak Oil is You

Donate Bitcoins ;-) or Paypal :-)
Page added on August 22, 2017
No Emotions, Only Facts And Numbers
Summary
Over the past quarter, the global oil market balance became more of a positive for the price of oil.
Judging by the dynamics of OPEC forecasts, global oil demand has been underestimated in the current year while supply has been overestimated.
There is reason to believe that, after the end of Q1 2018, OPEC will again be inclined to renew the agreement on limiting oil production.
Global oil market trends indicate the low probability of a new wave of price cuts in this market until the end of the current year.

Source: Stock photo
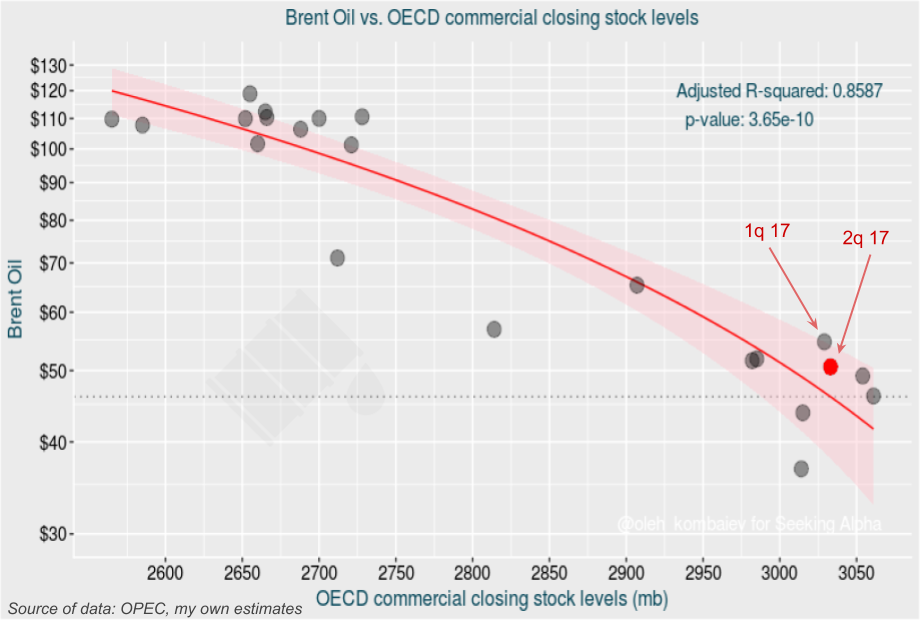
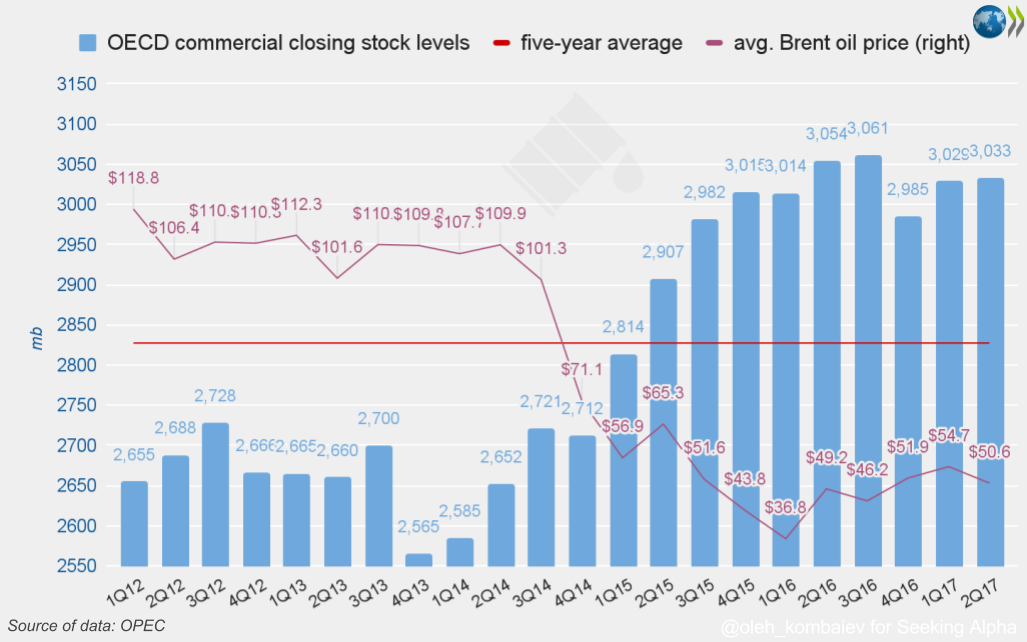
First of all, I would like to note that in the second quarter the balance in the global oil market has shifted toward demand – i.e., it at least became less “bearish.” I came to this conclusion based on the analysis of two models, which reflected the dependence of quarterly Brent prices on the level of commercial oil stocks accumulated in OECD countries and the number of days of forward consumption in OECD countries.
According to the first model, the commercial oil stocks in OECD countries at the end of Q2 2017 corresponds to Brent oil prices at the level of $48. That is very close to the current price – i.e., the price is almost balanced:
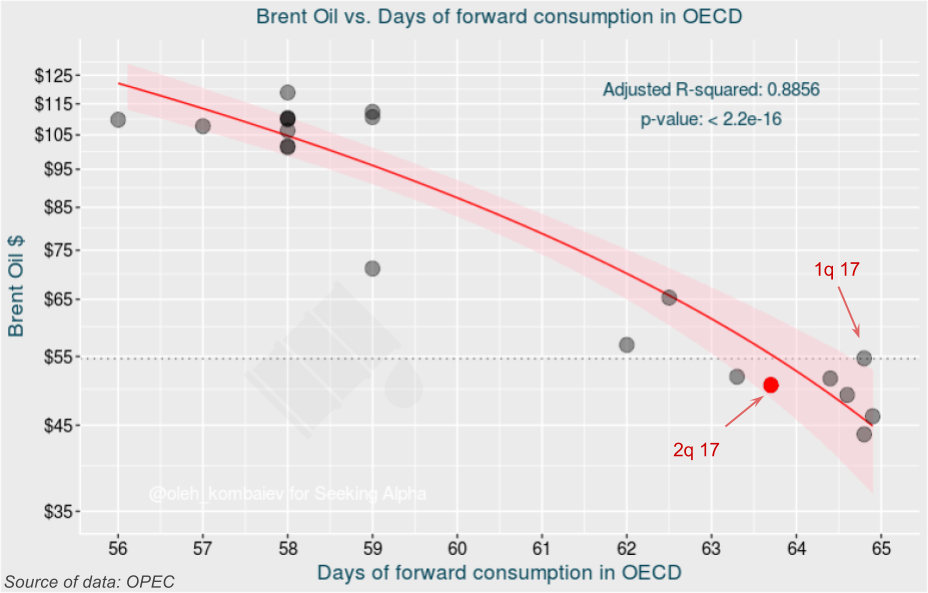
According to the second model, the number of days of forward consumption in OECD countries in Q2 corresponds to Brent oil prices at the level of $55, which exceeds the current price level by almost the size of a standard deviation. In other words, according to this model, the current market price of Brent oil is even below the sustainable level. I would like to note that this model is more acceptable because it reflects the dynamics of the demand.
So, after the wave of decline observed from May to June and the growth in July, the price of oil stabilized near the fundamentally justified level. What’s next?
In order to try to answer this question, I should first draw your attention to OPEC’s predictions concerning the global oil market. I am not talking about the last forecast, but about how OPEC changed its forecasts recently.
In July 2016, OPEC gave its first forecast regarding oil demand in OECD countries in 2017. In that forecast, OPEC predicted consumption at a level of 46.5 mb/d. Then, from month to month, OPEC gradually increased its forecast until it reached 47.2 mb/d, announced this month. As for 2018, OPEC gave only two predictions, where the demand for oil in OECD countries was also revised upward.
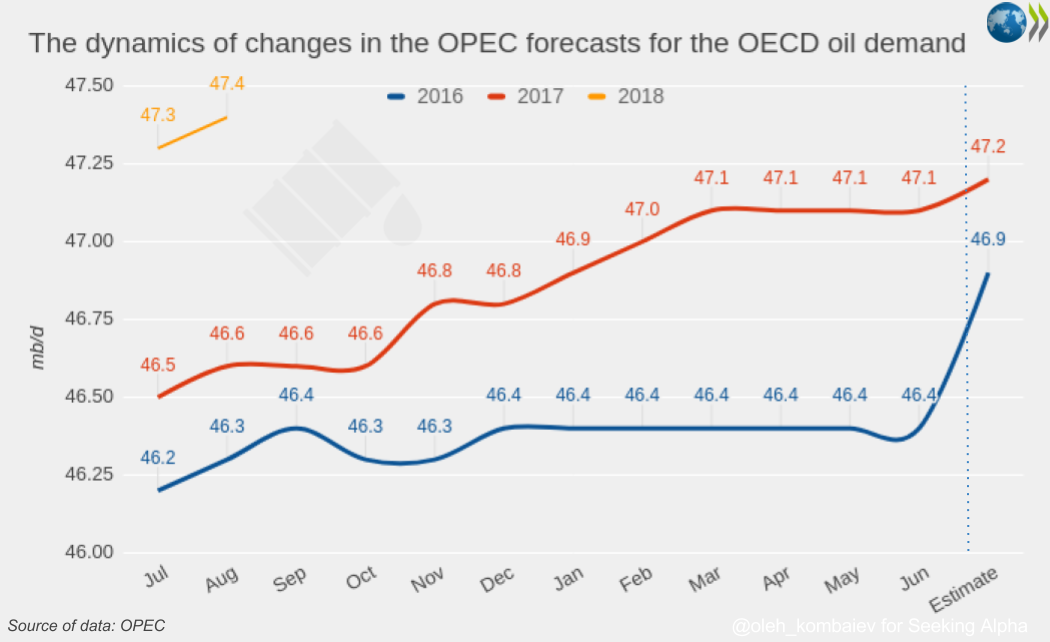
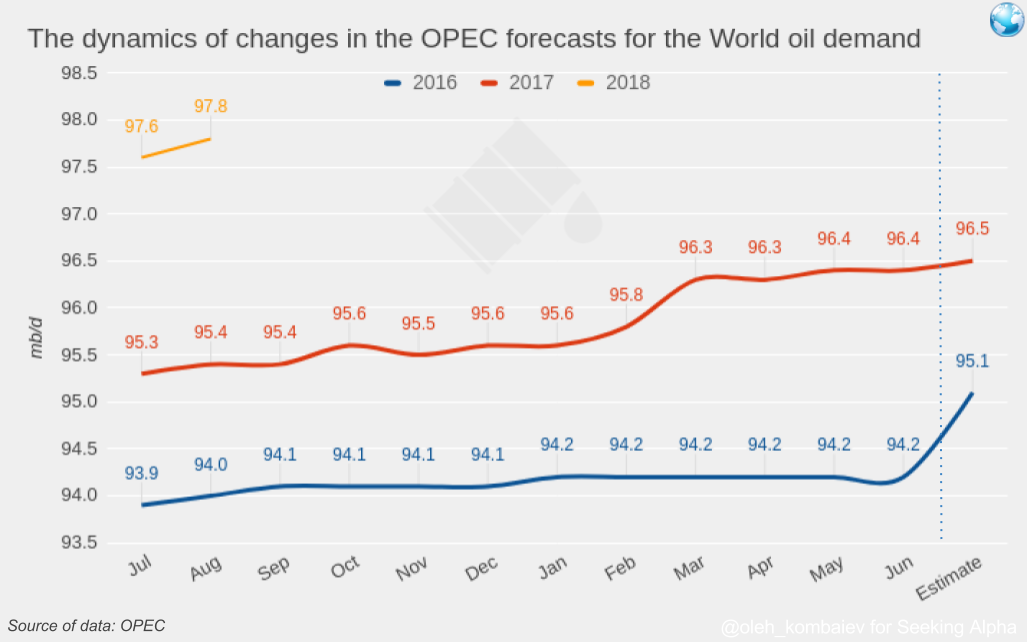
A similar thing is observed with OPEC’s forecasts for global oil demand. Thus, the first OPEC forecast assumed the world demand for oil in 2017 at the level of 95.3 mb/d, while the second was already at the level of 96.5 mb/d. The forecast for 2018 was also revised upward in August.
 As for OPEC’s forecasts regarding oil supply, they demonstrate inverse dynamics. In May, OPEC predicted oil production in non-OPEC countries in 2017 at the level of 58.2 mb/d. However, in the last forecast, this figure decreased to 57.8 mb/d. The oil production in 2018 outside of OPEC has also been reduced in August.
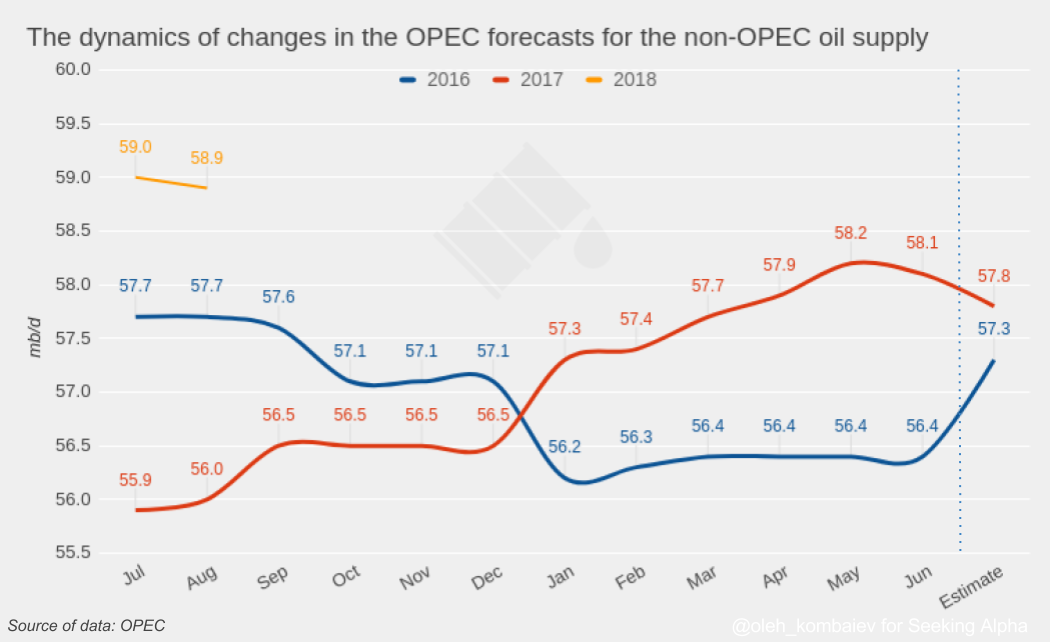
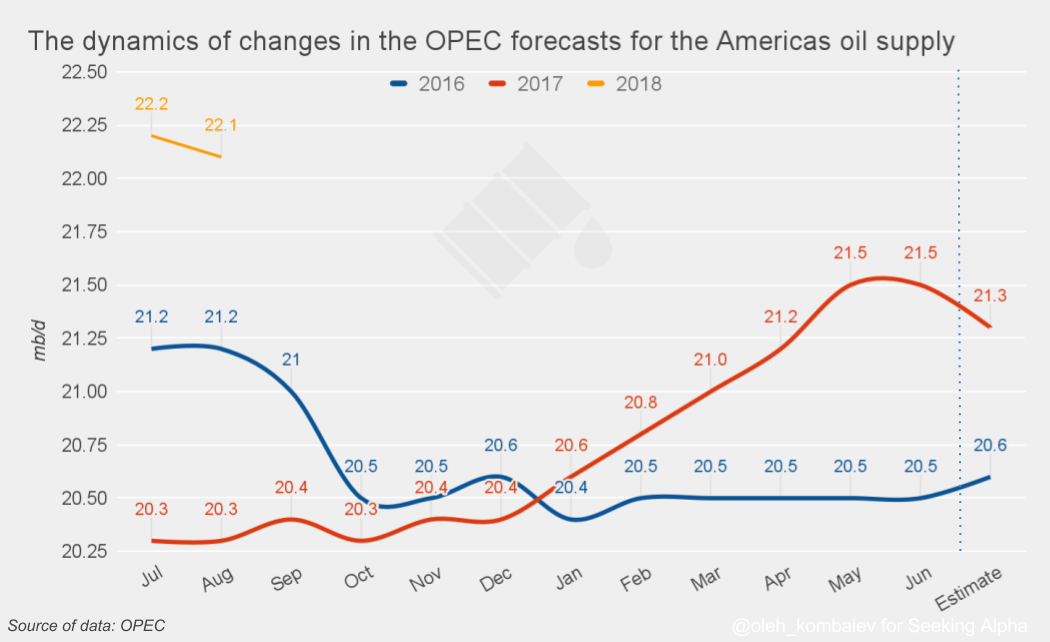
It is interesting to note that the main reason for the lowered expectations regarding oil production outside of OPEC is the decreased projections of the U.S. production level. In its latest forecast, OPEC predicts the average U.S. oil production level in 2017 at the level of 21.3 mb/d, although in May the predicted level was 21.5 mb/d.
So, judging by how OPEC changes its forecasts, it can be concluded that at least in 2017 world oil demand has been underestimated, whereas the supply capacity outside of OPEC has been overrated. Both are positives for the price of oil.
Moving on, using the latest OPEC forecast and assuming that OPEC oil production remains at the level of Q2 of the current year up to and including Q1 2018, we get the following picture of the global oil market balance for the next three quarters:

As you can see, in Q3 and Q4 there is a daily shortage of oil in the market of 1.2 mb and 0.7 mb, respectively. However, in Q1 2018 there will be a surplus at the level of 0.6 mb/d.
If we consider a conditional scenario where a global deficit or surplus of oil exclusively affects the commercial stocks of OECD countries, by the end of Q1 2018 these stocks will decline by 117 mb to 2916 mb. That is 89 mb above the five-year average – i.e., the stocks will be 89 mb above the goal pursued by OPEC, judging by official statements of its representatives.
And now the main question arises: Will the agreement on limiting oil production be extended in such circumstances? Two months ago, I was sure that it would not happen. But now I’m not sure.
Let’s go back to the end of 2016. After the agreement on limiting oil production was reached in the 171st OPEC meeting, Brent quickly grew to the level of $56 and passed into the lateral trend. At the time, I saw many predictions that the next stop would be $60. After these projections did not materialize and Brent was corrected to $50, it seemed as if the prolonging of the agreement in the 172nd OPEC meeting would make things better. Unfortunately, that did not happen.
At the same time, I noted that the statements of the parties involved in the agreement (the “OPEC+11”) became less optimistic. In particular, back in May the head of Rosneft (OTCPK:RNFTF), Russia’s largest oil company, considered it important for the Ministry of Energy to coordinate with the participating countries a smooth exit from the global agreement on limiting oil production after its expiry date, in order to avoid price volatility in the global market. After Brent tested the level of $44 in June, at least Russian oil oligarchs stopped making similar statements.
In my opinion, Brent under $50, even with the prolonging of the agreement on the limitation of oil production factored in, sobered up the parties to the agreement. If, at the end of Q1 2018, the agreement is canceled Brent will easily drop to $40 again. Apparently, this price level satisfies neither OPEC nor Russia.
In addition, it’s worth noting that judging from how U.S. oil stocks are changing, this year – for the first time in a long time – U.S. oil production lags behind the growth of its consumption. At least this can be considered the first OPEC success in its confrontation with U.S. shale producers.

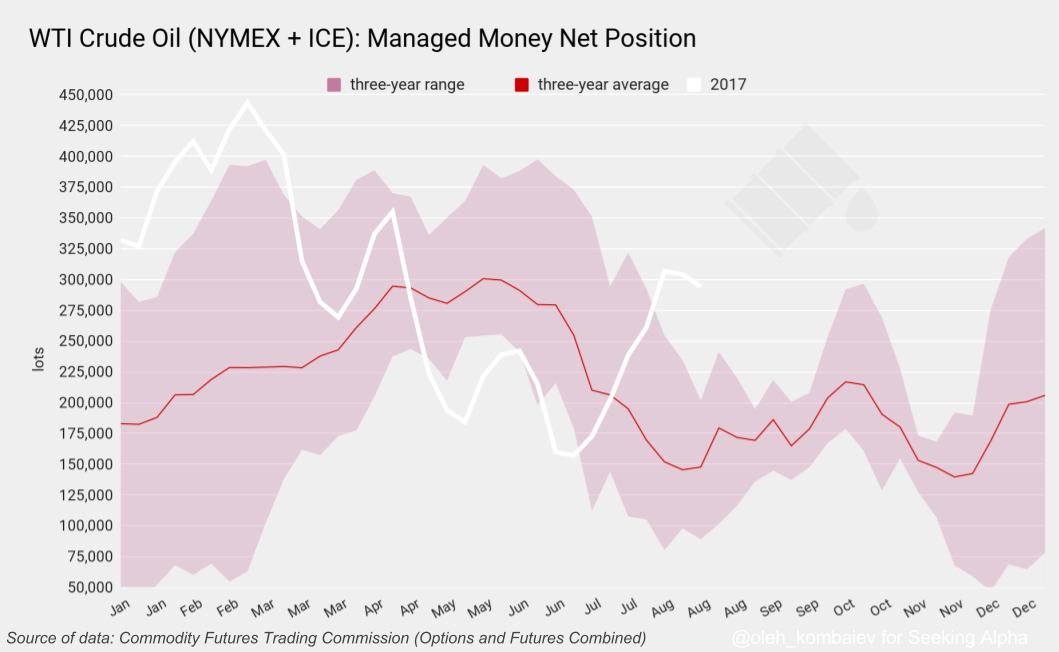
Finally, I would like to address the latest money managers’ actions that complement the overall picture. Since the beginning of July, hedge funds have increased their long positions in WTI (NYMEX and ICE) by 137,101 lots.
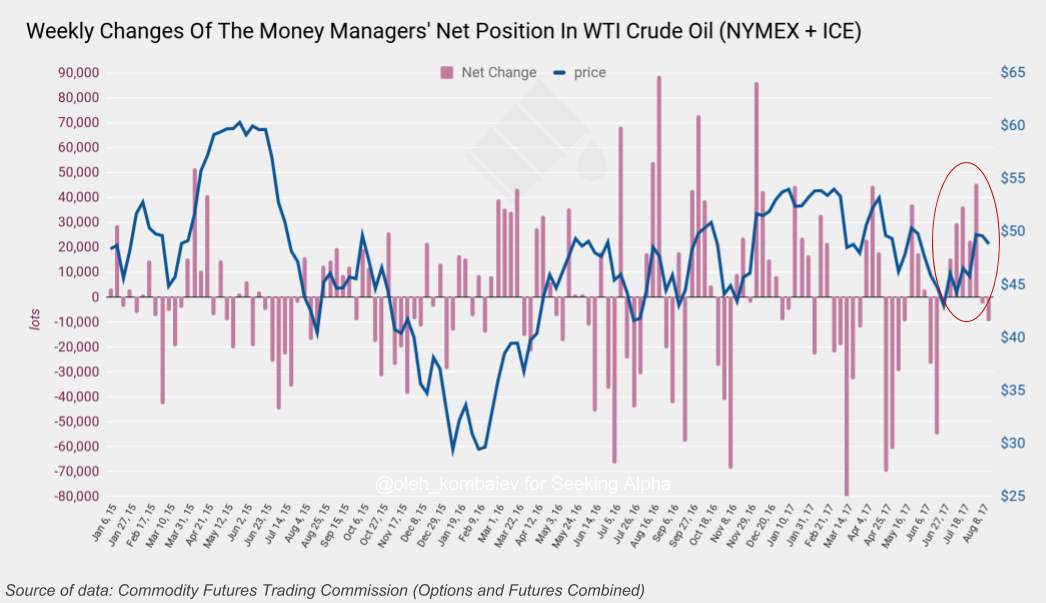
As a result, the total amount of their net long position significantly exceeds the three-year average level for this time of the year.
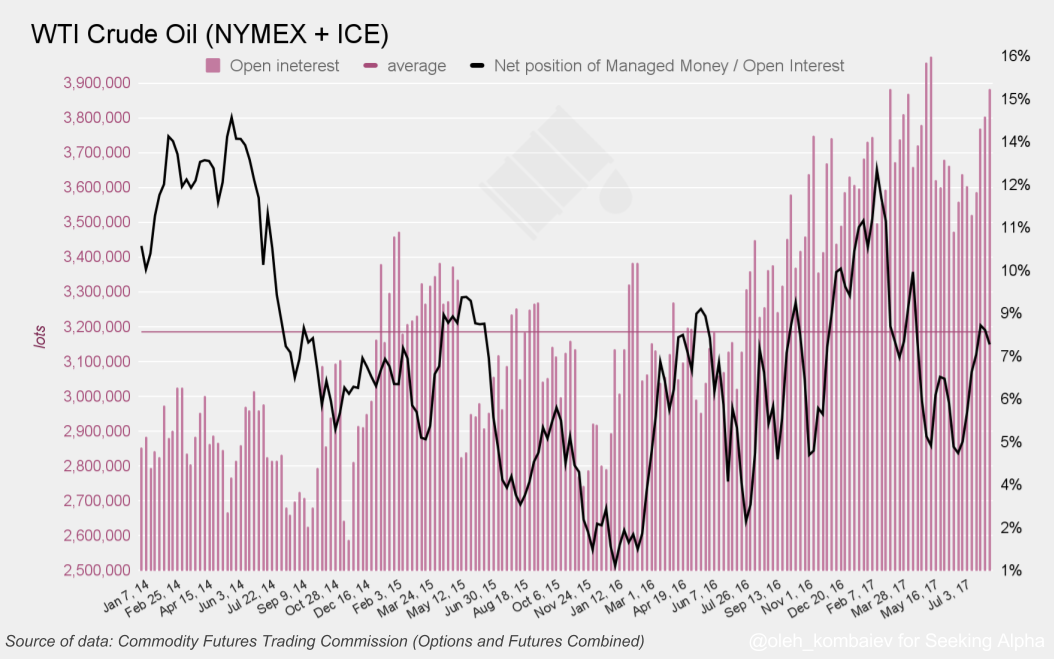
The liquidity of this market is growing, and the current money managers’ positions amount to 7.6% of the open interest, which is an average indicator.
 And, finally, predicting the WTI oil price based on the size of the money managers’ net position, we come to the conclusion that the current price almost corresponds to its balanced level:
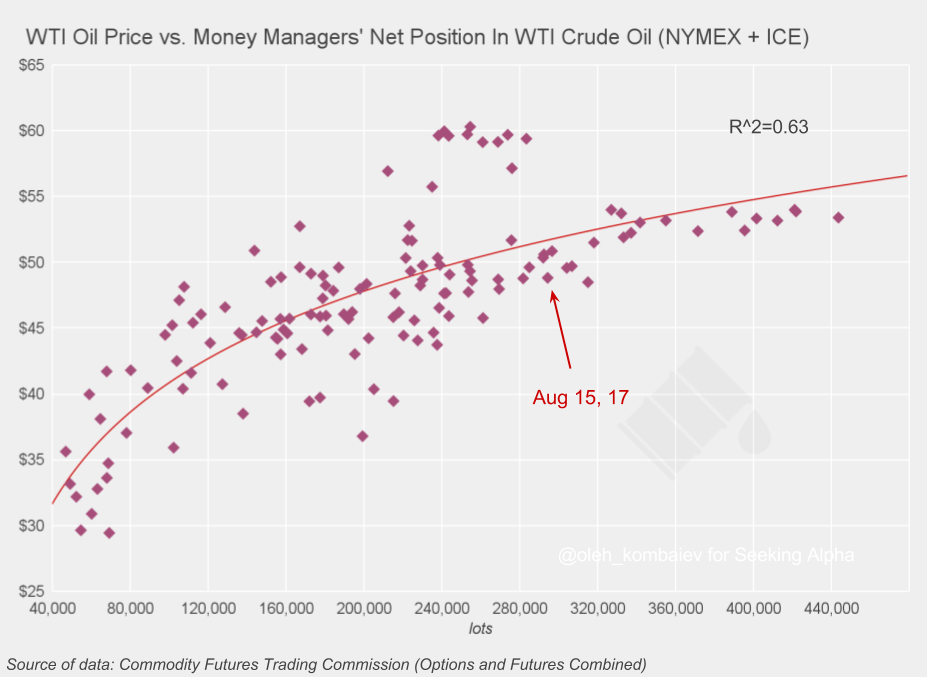
As we can see, the number of long positions held by the money managers is adequate to the current oil price, and, in my opinion, they are not getting ready for the next wave of decline.
Putting It All Together
So, I believe that before the end of the year, the new wave of oil price decreases is unlikely. At this point, the current balance of the global oil market, the expected deficit in the second half of the year, the observed growth in global consumption (which is higher than expected), the possibility of extending the agreement on the limitation of oil production at the end of Q1 2018 and money managers’ actions are not consistent with the “bearish” market.
In the immediate future, I think Brent and WTI prices will be moving in the ranges of $50-54 and $46-50, respectively. As such, now is probably a good time to sell put options.
Disclosure:I/we have no positions in any stocks mentioned, and no plans to initiate any positions within the next 72 hours.
I wrote this article myself, and it expresses my own opinions. I am not receiving compensation for it (other than from Seeking Alpha). I have no business relationship with any company whose stock is mentioned in this article.
Editor’s Note: This article discusses one or more securities that do not trade on a major U.S. exchange. Please be aware of the risks associated with these stocks.
7 Comments on "No Emotions, Only Facts And Numbers"
Apneaman on Tue, 22nd Aug 2017 5:05 pm
Inside the new economic science of capitalism’s slow-burn energy collapse
And why the struggle for a new economic paradigm is about to get real
“A groundbreaking study in Elsevier’s Ecological Economics journal by two French economists, for the first time proves the world has passed a point-of-no-return in its capacity to extract fossil fuel energy: with massive implications for the long-term future of global economic growth.”
https://medium.com/insurge-intelligence/the-new-economic-science-of-capitalisms-slow-burn-energy-collapse-d07344fab6be
Long-Term Estimates of the Energy-Return-on-Investment (EROI) of Coal, Oil, and Gas Global Productions
“Highlights
•
Through a price-based approach we assess the global energy-return-on-investment (EROI) of coal, oil, and gas.
•
This is done from their respective beginning of reported production (respectively 1800, 1860, and 1890) to 2012.
•
We also present a new theoretical EROI dynamic model based on Dale et al. (2011).
•
We find that maximum EROI of global oil and gas productions have both already been reached in the 1930s–40s, respectively around 50(± 15):1 and 150(± 20):1.
•
We estimate that the maximum EROI of global coal production will most likely be around 95(± 15):1 around the 2030s.
Abstract
We use a price-based methodology to assess the global energy-return-on-investment (EROI) of coal, oil, and gas, from the beginning of their reported production (respectively 1800, 1860, and 1890) to 2012. It appears that the EROI of global oil and gas productions reached their maximum values in the 1930s–40s, respectively around 50:1 and 150:1, and have declined subsequently. Furthermore, we suggest that the EROI of global coal production has not yet reached its maximum value. Based on the original work of Dale et al. (2011), we then present a new theoretical dynamic expression of the EROI. Modifications of the original model were needed in order to perform calibrations on each of our price-based historical estimates of coal, oil, and gas global EROI. Theoretical models replicate the fact that maximum EROIs of global oil and gas productions have both already been reached while this is not the case for coal. In a prospective exercise, the models show the pace of the expected EROIs decrease for oil and gas in the coming century. Regarding coal, models are helpful to estimate the value and date of the EROI peak, which will most likely occur between 2025 and 2045, around a value of 95(± 15):1.”
[The rest is pay walled]
http://www.sciencedirect.com/science/article/pii/S0921800915303815
MASTERMIND on Tue, 22nd Aug 2017 6:47 pm
Peak Shale: World’s Largest Miner Is Selling Its Shale Assets
http://fortune.com/2017/08/21/bhp-sell-shale/
bobinget on Wed, 23rd Aug 2017 8:24 am
Aug. 23 (UPI) — With inclement weather brewing in the Gulf of Mexico, Anadarko Petroleum said it pulled non-essential staff from its offshore facilities.
The National Hurricane Center in Miami, Fla., said there are indications that what’s left of Tropical Storm Harvey could redevelop into a tropical depression.
“Harvey could also produce storm surge and tropical storm or hurricane force winds along portions of the Texas coast later this week, and Tropical Storm or Hurricane Watches could be required later today for portions of the coast of northeastern Mexico, Texas, and southwestern Louisiana,” the forecast read.
bobinget on Wed, 23rd Aug 2017 9:43 am
Year over year, inventory declines.
Figures include all US petroleum inventories including SPR.
Week 2016 Inv 2017 Inv Difference
1 1,976,323 2,016,985 40,662
2 1,986,357 2,030,421 44,064
3 1,992,944 2,028,411 35,467
4 1,991,898 2,037,275 45,377
5 2,001,409 2,042,536 41,127
6 2,001,773 2,043,965 42,192
7 2,005,221 2,055,019 49,798
8 2,000,260 2,044,005 43,745
9 2,010,146 2,044,283 34,137
10 2,009,687 2,041,650 31,963
11 2,011,504 2,033,002 21,498
12 2,018,431 2,033,710 15,279
13 2,019,969 2,029,060 9,091
14 2,020,818 2,029,577 8,759
15 2,027,741 2,024,242 -3,499
16 2,027,316 2,022,382 -4,934
17 2,032,560 2,028,496 -4,064
18 2,034,629 2,028,335 -6,294
19 2,033,005 2,024,220 -8,785
20 2,032,352 2,027,760 -4,592
21 2,031,451 2,023,858 -7,593
22 2,028,712 2,017,669 -11,043
23 2,032,769 2,031,484 -1,285
24 2,032,090 2,037,892 5,802
25 2,037,274 2,035,194 -2,080
26 2,036,304 2,034,617 -1,687
27 2,039,717 2,020,837 -18,880
28 2,046,814 2,013,796 -33,018
29 2,049,435 2,003,611 -45,824
30 2,052,087 1,994,161 -57,926
31 2,054,214 1,995,258 -58,956
32 2,056,707 1,990,652 -66,055
33 2,058,027 1,983,336 -74,691
34 2,064,639 1,983,373 -81,266
bobinget on Wed, 23rd Aug 2017 9:45 am
Distillates consumption; + 14.4%
Lookie rat cheer
Total products supplied over the last four-week period averaged over 21.0 million barrels
per day, up by 1.4% from the same period last year. Over the last four weeks, motor
gasoline product supplied averaged 9.7 million barrels per day, down by 0.4% from the
same period last year. Distillate fuel product supplied averaged over 4.2 million barrels
per day over the last four weeks, up by 14.4% from the same period last year. Jet fuel
product supplied is up 1.3% compared to the same four-week period last year.
bobinget on Wed, 23rd Aug 2017 9:53 am
Again, with all the talk of OPEC declines,
we get 8.8 M B p/d imports. That’s, at minimum 1.8
M more than required to keep your car juiced.
U.S. crude oil imports averaged 8.8 million barrels per day last week, up by 664,000
barrels per day from the previous week. Over the last four weeks, crude oil imports
averaged over 8.2 million barrels per day, 3.1% below the same four-week period last
year. Total motor gasoline imports (including both finished gasoline and gasoline
blending components) last week averaged 555,000 barrels per day. Distillate fuel imports
averaged 132,000 barrels per day last week
All in all. We are being set-up for monster, long lasting PoO increases.
bobinget on Wed, 23rd Aug 2017 11:33 am
https://twitter.com/search?f=tweets&vertical=news&q=%23OOTT&src=tyah
GOM Coastal refineries, take notice.
If storm serge is timed for high tide, flee, take refinery key with.