Peak Oil is You

Donate Bitcoins ;-) or Paypal :-)
Page added on June 25, 2015
BP Data Suggests We Are Reaching Peak Energy Demand

Some people talk about peak energy (or oil) supply. They expect high prices and more demand than supply. Other people talk about energy demand hitting a peak many years from now, perhaps when most of us have electric cars.
Neither of these views is correct. The real situation is that we right now seem to be reaching peak energy demand through low commodity prices. I see evidence of this in the historical energy data recently updated by BP (BP Statistical Review of World Energy 2015).
Growth in world energy consumption is clearly slowing. In fact, growth in energy consumption was only 0.9% in 2014. This is far below the 2.3% growth we would expect, based on recent past patterns. In fact, energy consumption in 2012 and 2013 also grew at lower than the expected 2.3% growth rate (2012 – 1.4%; 2013 – 1.8%).
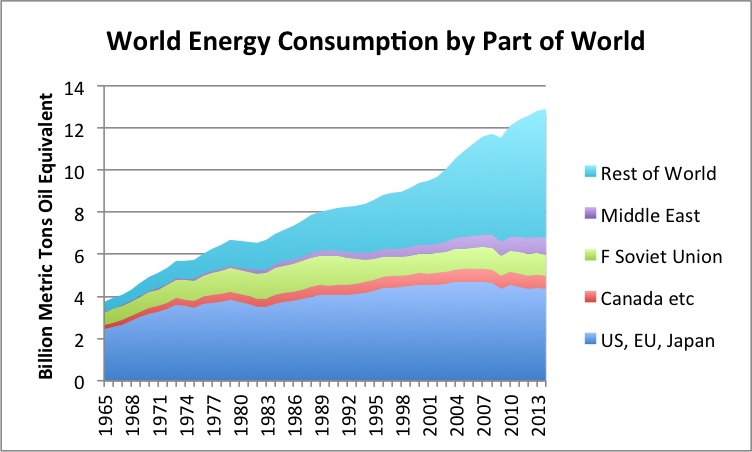
Figure 1- Resource consumption by part of the world. Canada etc. grouping also includes Norway, Australia, and South Africa. F Soviet Union means Former Soviet Union. Middle East excludes Israel. Based on BP Statistical Review of World Energy 2015 data.
Recently, I wrote that economic growth eventually runs into limits. The symptoms we should expect are similar to the patterns we have been seeing recently (Why We Have an Oversupply of Almost Everything (Oil, labor, capital, etc.)). It seems to me that the patterns in BP’s new data are also of the kind that we would expect to be seeing, if we are hitting limits that are causing low commodity prices.
One of our underlying problems is that energy costs have risen faster than most workers’ wages since 2000. Another underlying problem has to do with globalization. Globalization provides a temporary benefit. In the last 20 years, we greatly ramped up globalization, but we are now losing the temporary benefit globalization brings. We find we again need to deal with the limits of a finite world and the constraints such a world places on growth.
Energy Consumption is Slowing in Many Parts of the World
Many parts of the world are seeing slowing growth in energy consumption. One major example is China.
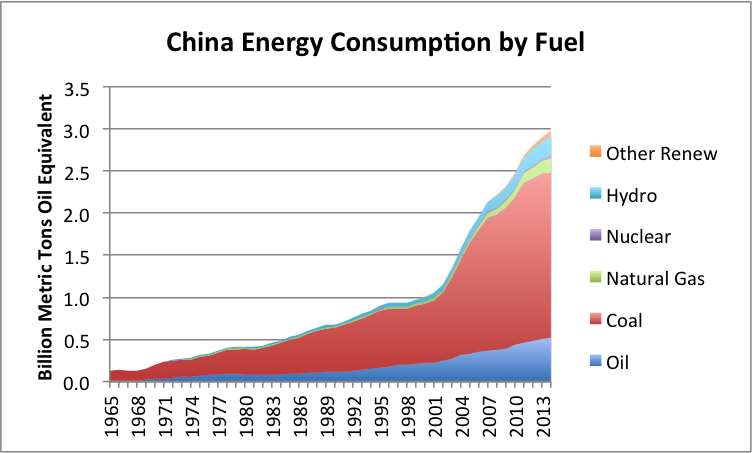
Figure 2. China’s energy consumption by fuel, based on data of BP Statistical Review of World Energy 2015.
Based on recent patterns in China, we would expect fuel consumption to be increasing by about 7.5% per year. Instead, energy consumption has slowed, with growth amounting to 4.3% in 2012; 3.7% in 2013; and 2.6% in 2014. If China was recently the growth engine of the world, it is now sputtering.
Part of China’s problem is that some of the would-be buyers of its products are not growing. Europe is a well-known example of an area with economic problems. Its consumption of energy products has been slumping since 2006.
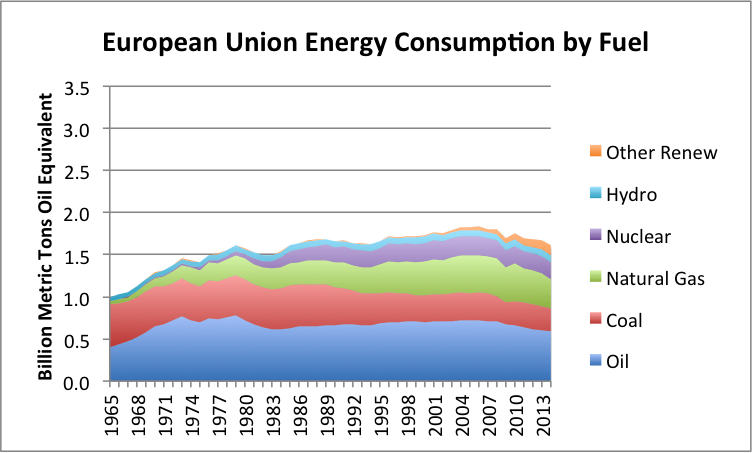
Figure 3. European Union Energy Consumption based on BP Statistical Review of World Energy 2015 Data.
I have used the same scale (maximum = 3.5 billion metric tons of oil equivalent) on Figure 3 as I used on Figure 2 so that readers can easily compare the European’s Union’s energy consumption to that of China. When China was added to the World Trade Organization in December 2001, it used only about 60% as much energy as the European Union. In 2014, it used close to twice as much energy (1.85 times as much) as the European Union.
Another area with slumping energy demand is Japan. It consumption has been slumping since 2005. It was already well into a slump before its nuclear problems added to its other problems.

Figure 4. Japan energy consumption by fuel, based on BP Statistical Review of World Energy 2015.
A third area with slumping demand is the Former Soviet Union (FSU). The two major countries within the FSU with slumping demand are Russia and Ukraine.
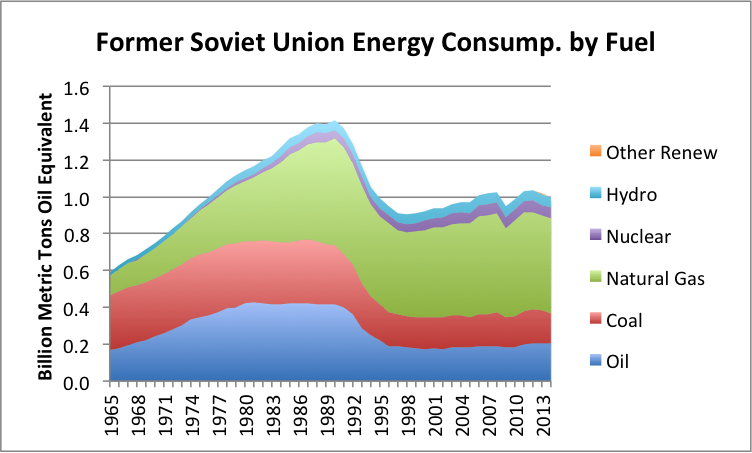
Figure 5. Former Soviet Union energy consumption by source, based on BP Statistical Review of World Energy Data 2015.
Of course, some of the recent slumping demand of Ukraine and Russia are intended–this is what US sanctions are about. Also, low oil prices hurt the buying power of Russia. This also contributes to its declining demand, and thus its consumption.
The United States is often portrayed as the bright ray of sunshine in a world with problems. Its energy consumption is not growing very briskly either.
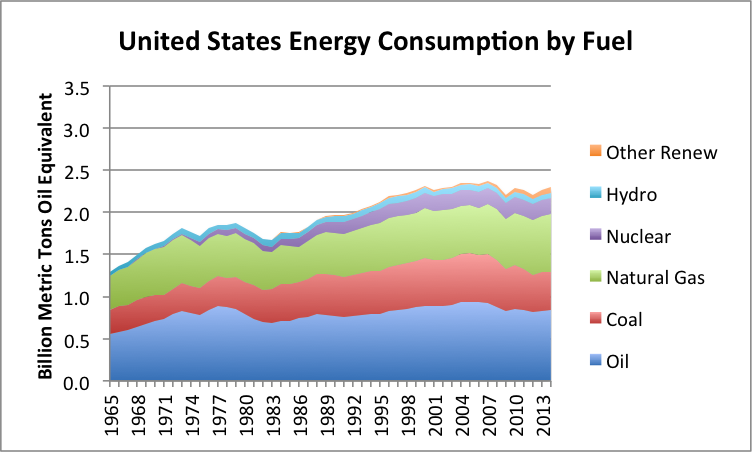
Figure 6. United States energy consumption by fuel, based on BP Statistical Review of World Energy 2014.
To a significant extent, the US’s slowing energy consumption is intended–more fuel-efficient cars, more fuel-efficient lighting, and better insulation. But part of this reduction in the growth in energy consumption comes from outsourcing a portion of manufacturing to countries around the world, including China. Regardless of cause, and whether the result was intentional or not, the United States’ consumption is not growing very briskly. Figure 6 shows a small uptick in the US’s energy consumption since 2012. This doesn’t do much to offset slowing growth or outright declines in many other countries around the world.
Slowing Growth in Demand for Almost All Fuels
We can also look at world energy consumption by type of energy product. Here we find that growth in consumption slowed in 2014 for nearly all types of energy.
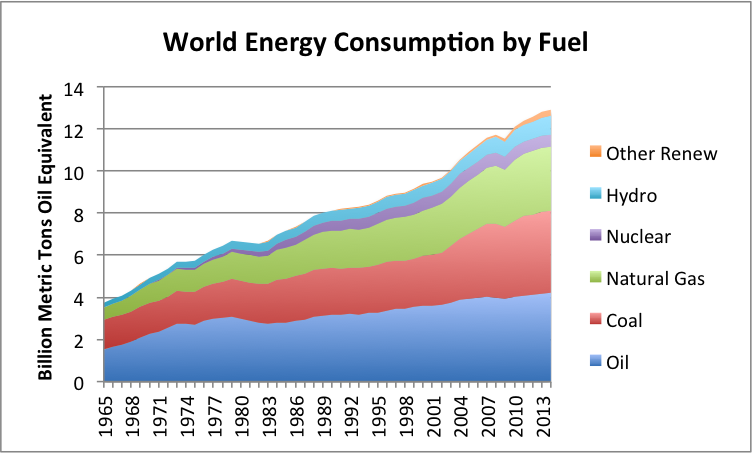
Figure 7. World energy consumption by part of the world, based on BP Statistical Review of World Energy 2015.
Looking at oil separately (Figure 8), the data indicates that for the world in total, oil consumption grew by 0.8% in 2014. This is lower than in the previous three years (1.1%, 1.2%, and 1.1% growth rates).
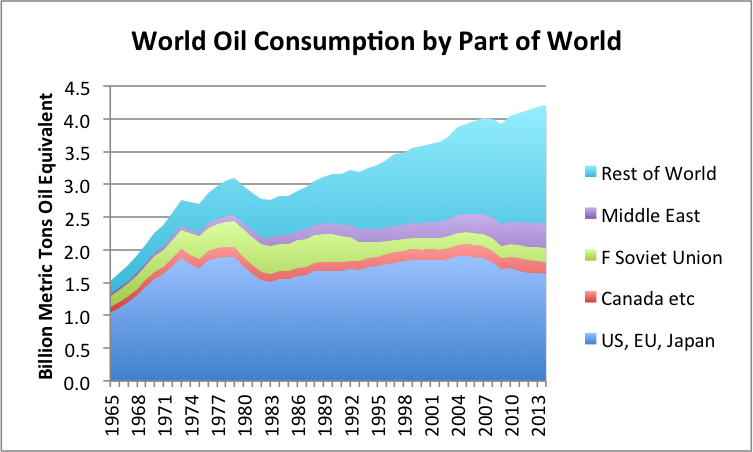
Figure 8. Oil consumption by part of the world, based on BP Statistical Review of World Energy 2015.
If oil producers had planned for 2014 oil consumption based on the recent past growth in oil consumption growth, they would have overshot by about 1,484 million tons of oil equivalent (MTOE), or about 324,000 barrels per day. If this entire drop in oil consumption came in the second half of 2014, the overshoot would have been about 648,000 barrels per day during that period. Thus, the mismatch we have recently been seeing between oil consumption and supply appears to be partly related to falling demand, based on BP’s data.
(Note: The “oil” being discussed is inclusive of biofuels and natural gas liquids. I am using MTOE because MTOE puts all fuels on an energy equivalent basis. A barrel is a volume measure. Growth in barrels will be slightly different from that in MTOE because of the changing mix of liquid fuels.)
We can also look at oil consumption for the US, EU, and Japan, compared to all of the rest of the world.
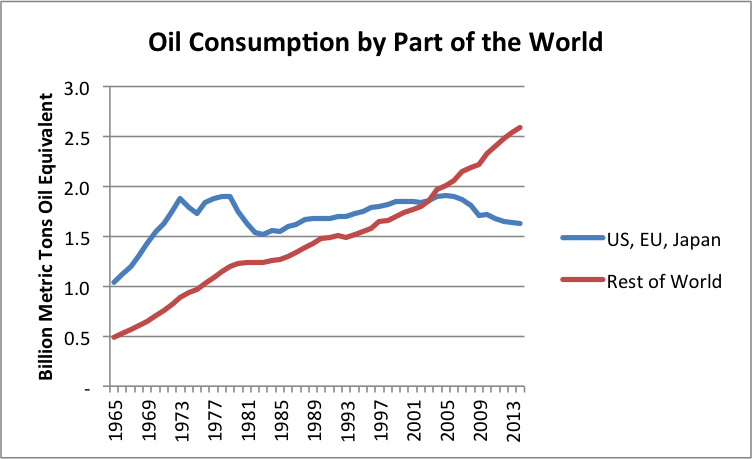
Figure 9. Oil consumption divided between the (a) US, EU, and Japan, and (b) Rest of the World.
While the rest of the world is still increasing its growth in oil consumption, its rate of increase is falling–from 2.3% in 2012, to 1.6% in 2013, to 1.3% in 2014.
Figure 10 showing world coal consumption is truly amazing. Huge growth in coal use took place as globalization spread. Carbon taxes in some countries (but not others) further tended to push manufacturing to coal-intensive manufacturing locations, such as China and India.
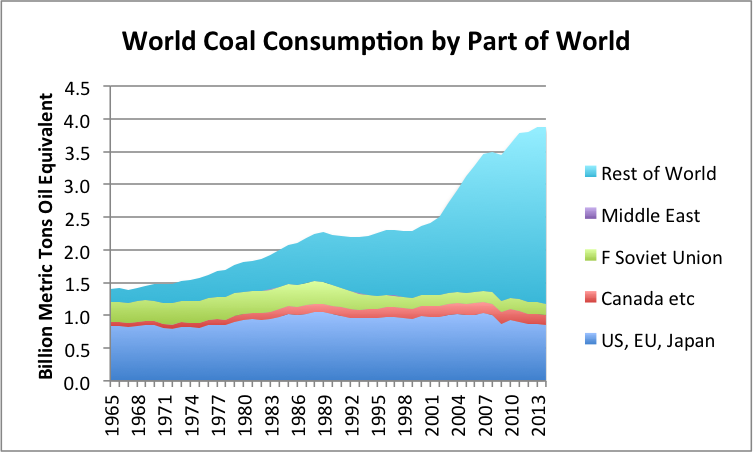
Figure 10. World coal consumption by part of the world, based on BP Statistical Review of World Energy 2015.
Looking at the two parts of the world separately (Figure 11), we see that in the last three years, growth in coal consumption outside of US, EU, and Japan, has tapered down. This is similar to the result for world consumption of coal in total (Figure 10).
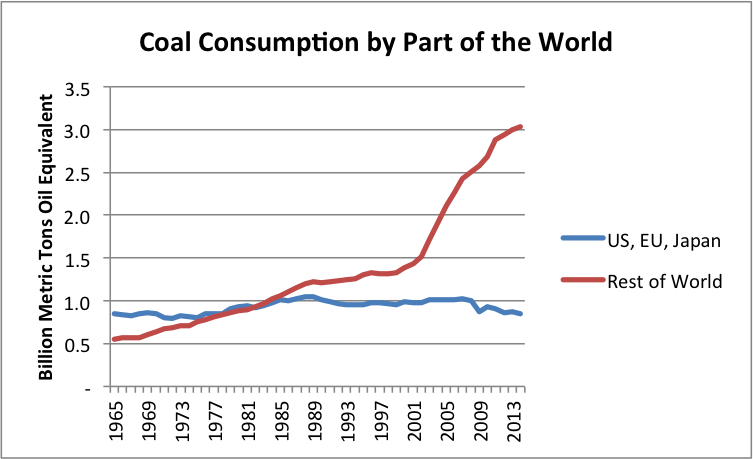
Figure 11. Coal consumption for the US, EU, and Japan separately from the Rest of the World, based on BP Statistical Review of World Energy data.
Another way of looking at fuels is in a chart that compares consumption of the various fuels side by side (Figure 12).
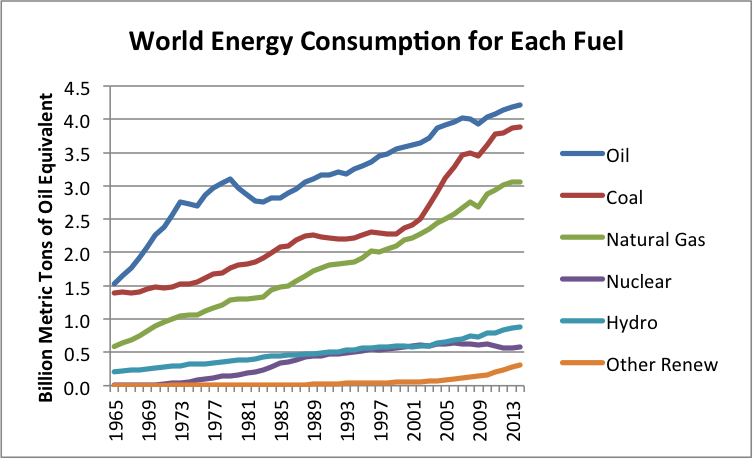
Figure 12. World energy consumption by fuel, showing each fuel separately, based on BP Statistical Review of World Energy 2015.
Consumption of oil, coal and natural gas are all moving on tracks that are in some sense parallel. In fact, coal and natural gas consumption have recently tapered more than oil consumption. World oil consumption grew by 0.8% in 2014; coal and natural gas consumption each grew by 0.4% in 2014.
The other three fuels are smaller. Hydroelectric had relatively slow growth in 2014. Its growth was only 2.0%, compared to a recent average of as much as 3.5%. Even with this slow growth, it raised hydroelectric energy consumption to 6.8% of world energy supply.
Nuclear electricity grew by 1.8%. This is actually a fairly large percentage gain compared to the recent shrinkage that has been taking place.
Other renewables continued to grow, but not as rapidly as in the past. The growth rate of this grouping was 12.0%, (compared to 22.4% in 2011, 18.1% in 2012, 16.5% in 2013). With the falling percentage growth rate, growth is more or less “linear”–similar amounts were added each year, rather than similar percentages. With recent growth, other renewables amounted to 2.5% of total world energy consumption in 2014.
Falling Consumption Is What We Would Expect with Lower Inflation-Adjusted Prices
People buy goods that they want or need, with one caveat: they don’t buy what they cannot afford. To a significant extent affordability is based on wages (or income levels for governments or businesses). It can also reflect the availability of credit.
We know that commodity prices of many kinds (energy, food, metals of many kinds) have been have generally been falling, on an inflation adjusted basis, for the past four years. Figure 13 shows a graph prepared by the International Monetary Fund of trends in commodity prices.
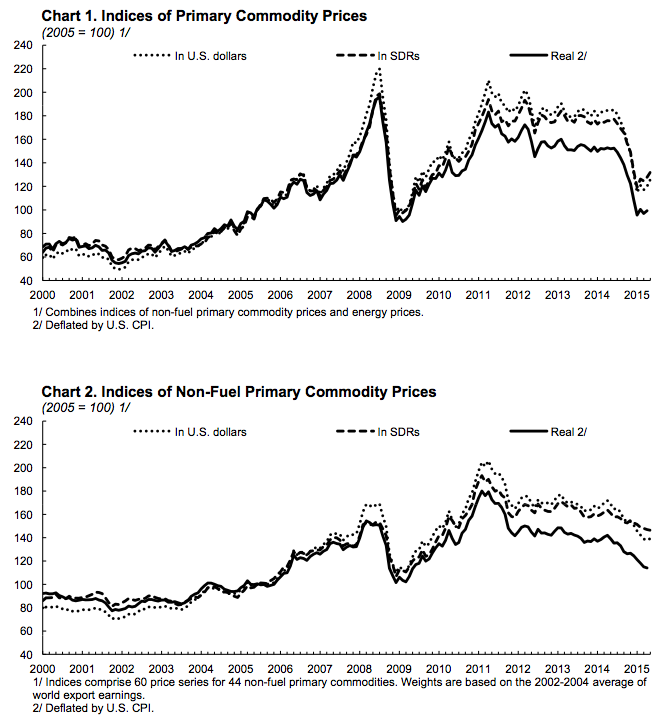
Figure 13. Charts prepared by the IMF showing trends in indices of primary commodity prices.
It stands to reason that if prices of commodities are low, while the general trend in the cost of producing these commodities is upward, there will be erosion in the amount of these products that can be profitably produced, and hence, that can be purchased. (This occurs because prices are falling relative to the cost of producing the goods.) If, prior to the drop in prices, consumption of the commodity had been growing rapidly, lower prices are likely to lead to a slower rate of consumption growth. If prices drop further or stay depressed, an absolute drop in consumption may occur.
It seems to me that the lower commodity prices we have been seeing over the past four years (with a recent sharper drop for oil), likely reflect an affordability problem. This affordability problem arises because for most people, wages did not rise when energy prices rose, and the prices of commodities in general rose in the early 2000s.
For a while, the lack of affordability could be masked with a variety of programs: economic stimulus, increasing debt and Quantitative Easing. Eventually these programs reach their limits, and prices begin falling in inflation-adjusted terms. Now we are at a point where prices of oil, coal, natural gas, and uranium are all low in inflation-adjusted terms, discouraging further investment.
Commodity Exporters–Will They Be Next to Be Hit with Lower Consumption?
If the price of a commodity, say oil, is low, this is a problem for a country that exports the commodity. The big issue is likely to be tax revenue. Governments very often get a major share of their tax revenue from taxing the profits of the companies that sell the commodities, such as oil. If the price of oil or other commodity that is exported drops, then it will be difficult for the government to collect enough tax revenue. There may be other effects as well. The company producing the commodity may cut back its production. If this happens, the exporting country is faced with another problem–laid-off workers without jobs. This adds a second need for revenue: to pay benefits to laid-off workers.
Many oil exporters currently subsidize energy and food products for their citizens. If tax revenue is low, the amount of these subsidies is likely to be reduced. With lower subsidies, citizens will buy less, reducing world demand. This reduction in demand will tend to reduce world oil (or other commodity) prices.
Even if subsidies are not involved, lower tax revenue will very often affect the projects an oil exporter can undertake. These projects might include building roads, schools, or hospitals. With fewer projects, world demand for oil and other commodities tends to drop.
The concern I have now is that with low oil prices, and low prices of other commodities, a number of countries will have to cut back their programs, in order to balance government budgets. If this happens, the effect on the world economy could be quite large. To get an idea how large it might be, let’s look again at Figure 1, recopied below.
Notice that the three “layers” in the middle are all countries whose economies are fairly closely tied to commodity exports. Arguably I could have included more countries in this category–for example, other OPEC countries could be included in this grouping. These countries are now in the “Rest of the World” category. Adding more countries to this category would make the portion of world consumption tied to countries depending on commodity exports even greater.
Figure 1- Resource consumption by part of the world. Canada etc. groupng also includes Norway, Australia, and South Africa. F Soviet Union means Former Soviet Union. Middle East excludes Israel. Based on BP Statistical Review of World Energy 2015 data.
My concern is that low commodity prices will prove to be self-perpetuating, because low commodity prices will adversely affect commodity exporters. As these countries try to fix their own problems, their own demand for commodities will drop, and this will affect world commodity prices. The total amount of commodities used by exporters is quite large. It is even larger when oil is considered by itself (see Figure 8 above).
In my view, the collapse of the Soviet Union in 1991 occurred indirectly as a result of low oil prices in the late 1980s. A person can see from Figure 1 how much the energy consumption of the Former Soviet Union fell after 1991. Of course, in such a situation exports may fall more than consumption, leading to a rise in oil prices. Ultimately, the issue becomes whether a world economy can adapt to falling oil supply, caused by the collapse of some oil exporters.
Our World Economy Has No Reverse Gear
None of the issues I raise would be a problem, if our economy had a reverse gear–in other words, if it could shrink as well as grow. There are a number of things that go wrong if an economy tries to shrink:
- Businesses find themselves with more factories than they need. They need to lay off workers and sell buildings. Profits are likely to fall. Loan covenants may be breached. There is little incentive to invest in new factories or stores.
- There are fewer jobs available, in comparison to the number of available workers. Many drop out of the labor force or become unemployed. Wages of non-elite workers tend to stagnate, reflecting the oversupply situation.
- The government finds it necessary to pay more benefits to the unemployed. At the same time, the government’s ability to collect taxes falls, because of the poor condition of businesses and workers.
- Businesses in poor financial condition and workers who have been laid off tend to default on loans. This tends to put banks into poor financial condition.
- The number of elderly and disabled tends to grow, even as the working population stagnates or falls, making the funding of pensions increasingly difficult.
- Resale prices of homes tend to drop because there are not enough buyers.
Many have focused on a single problem area–for example, the requirement that interest be paid on debt–as being the problem preventing the economy from shrinking. It seems to me that this is not the only issue. The problem is much more fundamental. We live in a networked economy; a networked economy has only two directions available to it: (1) growth and (2) recession, which can lead to collapse.
Conclusion
What we seem to be seeing is an end to the boost that globalization gave to the world economy. Thus, world economic growth is slowing, and because of this slowed economic growth, demand for energy products is slowing. This globalization was encouraged by the Kyoto Protocol (1997). The protocol aimed to reduce carbon emissions, but because it inadvertently encouraged globalization, it tended to have the opposite effect. Adding China to the World Trade Organization in 2001 further encouraged globalization. CO2 emissions tended to grow more rapidly after those dates.
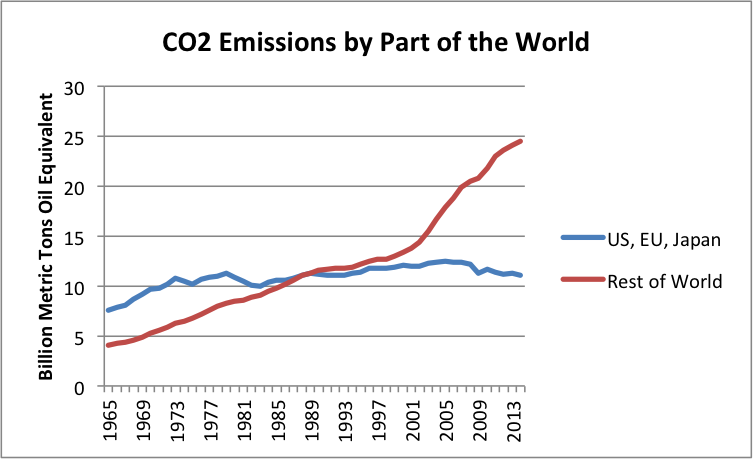
Figure 14. World CO2 emissions from fossil fuels, based on data from BP Statistical Review of World Energy 2015.
Now growth in fuel use is slowing around the world. Virtually all types of fuel are affected, as are many parts of the world. The slowing growth is associated with low fuel prices, and thus slowing demand for fuel. This is what we would expect, if the world is running into affordability problems, ultimately related to fuel prices rising faster than wages.
Globalization brings huge advantages, in the form of access to cheap energy products still in the ground. From the point of view of businesses, there is also the possibility of access to cheap labor and access to new markets for selling their goods. For long-industrialized countries, globalization also represents a workaround to inadequate local energy supplies.
The one problem with globalization is that it is not a permanent solution. This happens for several reasons:
- A great deal of debt is needed for the new operations. At some point, this debt starts reaching limits.
- Diminishing returns leads to higher cost of energy products. For example, later coal may need to come from more distant locations, adding to costs.
- Wages in the newly globalized area tend to rise, negating some of the initial benefit of low wages.
- Wages of workers in the area developed prior to globalization tend to fall because of competition with workers from parts of the world getting lower pay.
- Pollution becomes an increasing problem in the newly globalized part of the world. China is especially concerned about this problem.
- Eventually, more than enough factory space is built, and more than enough housing is built.
- Demand for energy products (in terms of what workers around the world can afford) cannot keep up with production, in part because wages of many workers lag thanks to competition with low-paid workers in less-advanced countries.
It seems to me that we are reaching the limits of globalization now. This is why prices of commodities have fallen. With falling prices comes lower production and hence lower total consumption. Many economies are gradually moving into recession–this is what the low prices and falling rates of energy growth really mean.
It is quite possible that at some point in the not too distant future, demand (and prices) will fall further. We then will be dealing with severe worldwide recession.
In my view, low prices and low demand for commodities are what we should expect, as we reach limits of a finite world. There is widespread belief that as we reach limits, prices will rise, and energy products will become scarce. I don’t think that this combination can happen for very long in a networked economy. High energy prices tend to lead to recession, bringing down prices. Low wages and slow growth in debt also tend to bring down prices. A networked economy can work in ways that does not match our intuition; this is why many researchers fail to see understand the nature of the problem we are facing.
66 Comments on "BP Data Suggests We Are Reaching Peak Energy Demand"
Northwest Resident on Fri, 26th Jun 2015 5:09 pm
GregT — You hurt Nony’s feelings yesterday, so today he unleashed marmico to extract vengeance on you with name calling and insults. I’ve probably gotten under Nony’s skin a little lately with my “Nony World” satire, so marmico had me in his sights as well. Don’t forget, we are dealing with a very disturbed individual here. You meet all types on Peak Oil forums that aren’t moderated, it seems.
marmico on Fri, 26th Jun 2015 5:13 pm
The three amigo fucking goofs!
GregT on Fri, 26th Jun 2015 5:16 pm
And you wonder why you can’t find a girlfriend…………
Apneaman on Fri, 26th Jun 2015 5:26 pm
nony-marm, way to use the internet to look up an almost long gone Canadian derogatory phrase that only ever had any real offense to a certain, shall we say, class of people.
beammeup on Fri, 26th Jun 2015 8:09 pm
NR – Well, it’s really a question of timing, isn’t it? I first read about peak oil 15 years ago. I was still early in my career in corporate America, and there were some in PO forecasting imminent collapse, while others believed in a long decline scenario. The imminent collapse group believed in a near term zombie apocalypse that would render all BAU endeavors moot. So the logic was to drop out of the system and switch into full prepper mode.
While no thinking person can doubt that any finite resource that is relentlessly consumed will eventually decline, I always believed it more likely that the decline would happen over a long period – a long bumpy plateau, followed by a gradual and bumpy descent. Big systems with lots of inertia generally don’t change course instantaneously, unless some disruptive new technology causes a sudden paradigm shift. Dropping out of the economic system in anticipation of an immediate collapse didn’t seem prudent then, and the intervening years have proven that assessment to be correct. I’ve been fortunate to have had a rewarding career that has put me in good position to survive a long “down” period, much better than if I’d dropped out of the system 15 years ago. I still don’t believe there will is an imminent zombie apocalypse, although I do believe we could see a market correction that could result in a step down for the world economy that could be protracted.
My sense is that the long decline scenario has already started, and will continue. But it won’t happen so fast or be so severe as to warrant dropping out of the system and retreating to a safe house in the wilderness. It does warrant diversifying ones investments, taking some reasonable precautions wrt to hard assets and most importantly, keep ones antennae up to shifts in the winds of current events. Visiting these forums is part of my strategy for doing that.
As to your question – how can oil usage be up if the world economy is so lackluster? – I think the answer is twofold: (1) As lackluster as things have been in the OECD, there has been real advancement in the standard of living in the developing world. My business takes me to Asia frequently, and the changes there for the average Joe have been quite profound. (2) There are more people being born into the world every day. So it’s entirely possible for the future to hold a scenario of declining per capita energy usage and declining standards of living while overall energy and/or oil usage increases.
Northwest Resident on Fri, 26th Jun 2015 9:10 pm
beammeup — Like you, I have a professional career going and never contemplated dropping out. That isn’t an option for me. I’m riding BAU out to the bitter end. But at the same time, I’m making urgent and fairly dramatic preparations because unlike you, I’m not much of a believer in the long slow emergency. Except, of course, unless we count the last twenty or more years as part of that long decline. My job puts me right in the middle of global finance and “the market”. Despite all the many signals of distress, even those during the near total collapse that occurred in the 2007-2008 timeframe, I never got the feeling that we were coming up on the end of the road. But a couple of years ago it suddenly occurred to me that something dramatically bad was in the works, it was as much an intuitive feeling as it was an evaluation of fact. Everything I’ve learned and experienced over the last two years of intense study has convinced me that we are on the very edge of dramatic times. We see the beginnings of chaos and water and food shortages all over the world. Climate refugees approaching the millions, and destined to get worse. Having an education in Public Relations and an intuitive sense of all the methods used to influence public opinion, I see a monumental effort by TPTB to keep the population pacified, because the truth were it widely known would lead to mass panic and the end of this world as we know it. That time is coming anyway. The global economy is fragile, broken beyond repair and destined to fail miserably. I’m one of those who believe in the “step down” theory of collapse, except I’m pretty sure that first big step down is going to be a whopper and will by itself be the very definition of near-total collapse. So, like you, I monitor this and many other sites daily, every day, looking for signals that might give me a head start on battening down the hatches for the coming storm. I engage in discussion on this topic here and no where else. I’m lucky to have a brother close by who is equally aware of these topics, and some friends who are starting to recognize how bad things are getting. Now, from my point of view, it is just a waiting game, and I don’t think we’ll have to wait much longer.
I think you’re right on why oil usage is up even though economies are down. That was a nice little burst of growth that the Asian countries got, other places around the world got their little burst of the so-called American “good life” too. But it isn’t going to last.
I’ve got a mini-farm going where I calculate that I’ll be able to raise enough food on my own to adequately feed myself and those closest to me. I have real life experience in growing my core crops, I have the seed, I can teach other people who are tough enough to do the work how to grow enough food to survive.
I wouldn’t put too much hope in maintaining your investments, diversified as they may be. I think the bottom is going to drop out of BAU fast and furious and, with no more magnificent “easy to extract” high-quality oil reserves left, there won’t be enough energy to launch us out of the economic downturn which is surely coming.
My two cent’s worth — or maybe buck’s worth.
peakyeast on Fri, 26th Jun 2015 9:33 pm
“What is the difference between 50:1 EROI at the oil wellhead 50 years ago and 10:1 EROI today when it comes to the distance travelled on a gallon of gasoline in a car?”
A little – I see many today blends the gasoline with biofuels that has a lower energy content.
The differences are everywhere else. Which you know already.
In the first case the economy is great and there is prosperity and happiness (1960s) in the 1:10 case everybody is getting edgy and nervous and aggressive even desperate and a lot of people are economically depressed… Biggest rise in malnutrition and uprisings against the governments – and so forth…
Whats the point with this question?
If the point is that a given amount of oil at different EROEI levels is the same then the question is totally irrelevant and lacks any meaningful connection to what happens to the population and economy at those levels – besides the changes to the gasoline you put in the tank.
Nony on Sat, 27th Jun 2015 12:24 am
Maybe of interest to the more quantitative peakers (Enno, Dean, DC):
http://seekingalpha.com/article/3277105-bakken-defying-oil-price-gravity
Makes the argument that producers could (will?) start drawing down the fraclog and basically keep Bakken output plateaued through 2015. After that, some decline is likely assuming prices/rigs (at 75) stay as is. Need more like 120 rigs to keep flat production in 2016, after fraclog gone. And 150+ rigs to get serious growth going (and in that cases services prices go up also…so need some serious price increase for oil).
P.s. Rock, I know you are going to want to react to the post comment without reading a long technical article…so yes, he does estimate the “normal” fraclog and only considers the excess current capacity, not the total amount.
Enno Peters on Sat, 27th Jun 2015 3:24 am
Nony, indeed a good article.
I do think there might be some issues with the data he used though, and I posted my response.
But I agree that your numbers on the required rigs are probably in the right ball park, if well profiles keep where they are right now. These profiles have changed remarkably downwards over the last few months, so that is not a given.
Davy on Sat, 27th Jun 2015 8:40 am
Beam said “I always believed it more likely that the decline would happen over a long period – a long bumpy plateau, followed by a gradual and bumpy descent. Big systems with lots of inertia generally don’t change course instantaneously, unless some disruptive new technology causes a sudden paradigm shift.”
Beam, what you say has lots of truth in my view but I would be careful with descent. Descent is not the same as a steady gradual growth in its systematic nature. Descent can be sudden, random, and irrational. That is the nature of decay.
I am hoping for a longish emergency for a number of reasons. I feel there are many activities and lifestyles we can weed out of the system that are poor uses of resources and not to mention destructive socially. I feel a descent will initiate some kind of crisis that will focus our attention on mitigation and adaptation to descent and all the other predicaments we face. A descent may allow us to have real carbon reductions for example. I still believed we are cooked with climate change but who knows with such a large and complex system.
My biggest question is can we hold this global system together that supports all our delocalized locals in a descent. What I mean by delocalized is nearly all locals are no longer self-resilient or self-sustainable. There are some on this board that like to mention the third world subsistence farmers but they are in many cases surrounded or near population overshoot. It is only the global that keeps this population overshoot from disrupting the local subsistence. Most advanced areas are locked in a consumption dependence globally.
I personally am thinking we will enter a bumpy descent that can limp along for a few years mainly because this bumpy descent can be made to look like lackluster growth by the powers to be. An appearance of growth is vital for our complex global system.
It is going to come down to just a few important variables for global stability. The most important ones are food production, liquid fuel availability, and systematic stability from confidence. All three of these are under pressure. All we need is two years of poor global harvest to disrupt social fabric dangerously. Liquid fuels can be disrupted for so many peak oil dynamic reasons. Our fragile economic and financial system must have solid confidence to facilitate the liquidity that is needed to maintain dispersed global production, distribution, and exchange.
Personally I find the system sturdy until these variables are threatened. Once threatened the system becomes destabilized and because of our vast global overshoot very vulnerable to collapse. This is the reason a bumpy descent whether overt or covert is so dangerous. Decay can disrupt food, fuel, and or confidence. Maybe our ignorance as a global people will keep our curiosity subdued. Personally I think we are done now and if people cultivated mine and other’s doomer views found all over the net all confidence would be lost. Just imagine if the POTUS would start talking doom!
Davy on Sat, 27th Jun 2015 9:06 am
Chinese Financial decay:
http://www.zerohedge.com/news/2015-06-26/critical-debt-domino-chain-threatens-destabilize-chinas-financial-system-socgen-says
China’s local governments have managed to accumulated a debt pile worth 35% of GDP via off-balance sheet, high-cost loans which are now being swapped for low interest muni bonds in an effort to reduce debt servicing costs and extend WAM. This is part of a wider effort on China’s part to deleverage an economy laboring under $28 trillion in debt. This deleveraging effort goes far beyond local government debt, as Beijing is now moving to allow for more corporate defaults as the country moves to liberalize its financial markets.
http://www.zerohedge.com/news/2015-06-27/desperate-china-cuts-key-policy-rates-after-stock-market-crash-its-just-1987
A Desperate China Cuts Key Policy Rates After Stock Market Crash; “It’s Just Like 1987”
Nony on Sat, 27th Jun 2015 11:43 am
Enno, thanks for looking at it. I know you watch this stuff pretty closely and would have some issue with the NDIC fraclog, etc. Still the approach seems decent.
I have a hard time believing that wells suddenly got worse. Too much a coincidence and logical reasons for them to get better. I suspect some aspect of contango trade in JAN-APR affected this: choking, days offline, etc. Maybe even operator population (EOG holding back).
Enno on Sat, 27th Jun 2015 11:57 am
I agree that it is quite unlikely that it is caused by worsening wells, but probably by operator (in-)action. Still, it was a surprise to me that such a strong effect is visible, and it will be interesting to see how quickly that reverts back with supposedly rising oil prices.
Outcast_Searcher on Sat, 27th Jun 2015 12:23 pm
marmico said: “3. The assumption is that distance travelled per gallon has doubled between 1965 and 2015. Joe drives 98 units (@50:1 EROI) and Jane drives 180 units (@10:1 EROI) per 100 units at the wellhead.”
marmico, the problem I have is with the assumption. Intelligent policies could certainly make this true. If Jane were likely to drive, say, a Prius C because gasoline taxes reflected something close to the social cost of oil (pollution, AGW, defense, scarcity, etc) then she’d likely get a lot of miles per unit of gasoline.
Unfortunately, as the recent plunge in oil prices has again shown, as soon as people think “gas is cheap again” (at least for the next month or three), then they’re buying stupid big trucks and SUV’s AND driving more miles again.
And then in a few years or so when oil makes gasoline expensive again, of course, it will be everyone ELSE’s fault.
theedrich on Sun, 28th Jun 2015 3:13 am
There are two massive dynamics now pushing us toward collapse: offshoring and automation. The developed world, and in particular Americans, are as a whole too accustomed to BAU and the past to grasp what is looming before us. Our politicians conspire to maintain the national slumber : “Elect me and you won’t have to do anything else ; I will solve all of your problems.” Ø and HotFlash Hillary are focused on inciting Black (and illegal aliens’) race hatred against “privileged” Whites to win another presidency in 2016. Presumably HotFlash will hire all of the Bloods and Crips as high-wage computer technicians to refloat our sinking economy.
Reality, however, will brush all of such Leftist drivel aside as global poverty migrates to Yankeeland. There will, of course, be calls for a “guaranteed minimum wage” — like the Saudis give their masses with their oil money. The promoters of such ideas refuse to discuss the diabolical details involved. After all, Joe Stalin made it work, didn’t he?
All the techno-optimism notwithstanding, so-called “good jobs” are increasingly shipped abroad or filled by robots and computers. When our tatooed hopheads and educational dropouts start working for the same wages as Vietnamese coolies, and have no money to spend on the next cellphone or other toy, what will happen to the economy? Maybe our glorious leaders will be forced to do something different. In the past, that has meant declaring war on rich countries in order to spread American wonderfulness. Americans love the idea of bombing Dresden and Hamburg, of nuking Hiroshima and Nakasaki. That path should lead to another century of Truth, Justice and the American Way.
flagle on Tue, 7th Mar 2023 2:07 am
Carbon taxes in certain nations (but not others) pushed production to coal-intensive manufacturing locales like China and India.