Peak Oil is You

Donate Bitcoins ;-) or Paypal :-)
Page added on April 10, 2017
Oil – Expect More Uncertainty
Summary
In this article, I decided to go over some weekly oil statistics that cover production, demand, inventories, etc.
I found a mixed but slightly bearish picture facing the industry, but demand figures suggest that there is still some bullish data out there.
I also looked at export data and figured that, with regulatory changes finally having an impact, the market should expect more uncertainty in forecasts moving forward.
Over the past week, a slew of interesting oil data has come out that has painted a rather intriguing picture of the market as a whole. While there were some bullish signs in the data provided, there were also some bearish ones that market participants would be unwise to ignore. In what follows, I will look at all of this data and more and give my thoughts on what it should mean for investors in companies like Whiting Petroleum (NYSE:WLL), Chesapeake Energy Corp. (NYSE:CHK), Approach Resources (NASDAQ:AREX), and Legacy Reserves (NASDAQ:LGCY), as well as for the United States Oil ETF (NYSEARCA:USO) and other oil-related ETFs moving forward.
Inventories were mixed but mostly bad
One place that oil data looked rather bad was in the category of crude inventory. According to the EIA (Energy Information Administration), for instance, total crude stocks for the week came out to 535.5 million barrels. This represents an increase of 1.5 million barrels compared to the 534 million barrels that stocks stood at a week earlier. On the whole, this move higher isn’t all that large, but it is bad when you consider that the API (American Petroleum Institute) had estimated a stock drop of 1.8 million barrels for the week and that analysts were anticipating a decrease of about 0.15 million barrels. In the graph below, you can see the trend that crude stocks have taken over the past 52 weeks.
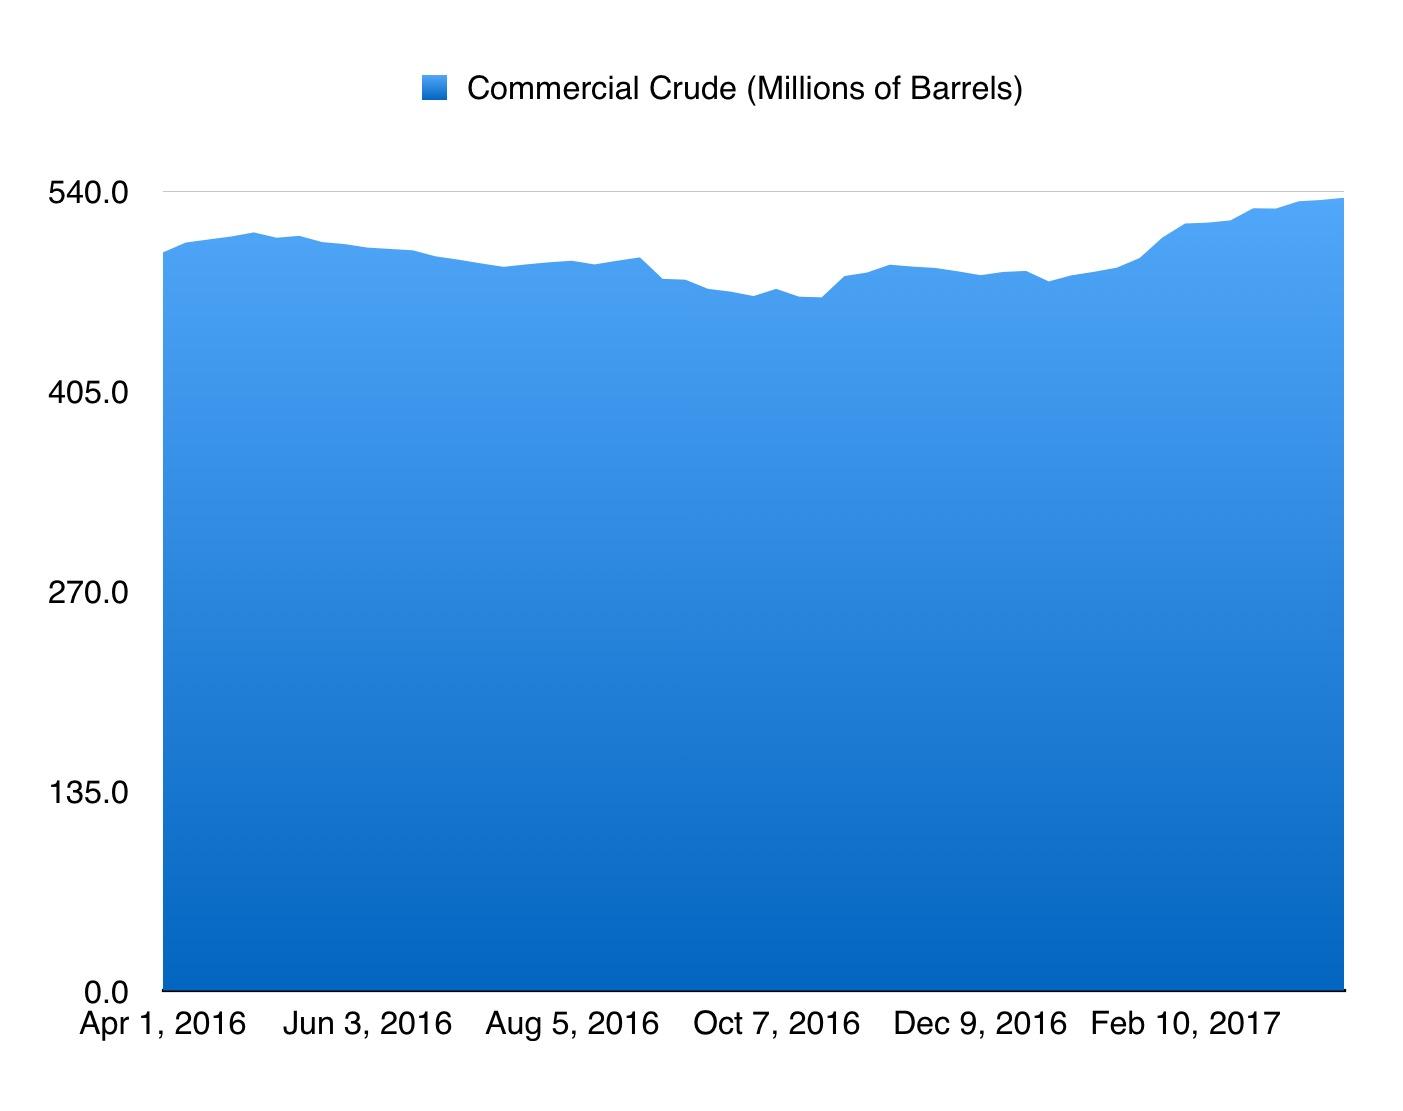
*Created by Author
While crude stocks were higher, some categories did show improvement during the week. Take, for example, motor gasoline stocks, which declined by 0.6 million barrels to 239.1 million barrels. Distillate fuel stocks saw a similar decline, dropping by 0.5 million barrels to 152.4 million barrels, and residual fuel stocks dipped 0.7 million barrels to 39.6 million. The biggest mover on the downside, though, was propane/propylene, which saw inventories fall by 1.2 million barrels from 42.8 million barrels to 41.6 million.
With all of these areas of decline, you would think that total stocks for the week would have fallen, but that was, sadly, not the case. Fuel ethanol stocks grew by 0.4 million barrels to 23.7 million and kerosene-type jet fuel stocks inched up 0.2 million barrels to 42.1 million. The “Other” category of petroleum products, though, was the big mover, with stocks having risen by 2 million barrels to 263.5 million. Thanks to this, total crude plus petroleum stocks for the week came in at 1.3374 billion barrels, 1 million barrels above where it stood a week earlier.
Rising production but demand is hopeful
One big negative for the week, according to the EIA, was domestic oil production. Based on their estimates, this figure came out to 9.199 million barrels per day. This represents an increase of 52 thousand barrels per day (or 364 thousand barrels per week) over the 9.147 million barrels per day seen a week earlier. Thankfully, 12 thousand barrels of this was a fluctuation from Alaska, so it’s likely we could see that reverse at some point, but the trend toward higher output is undeniable. In the graph below, you can see the trend that domestic production has taken over the past year.
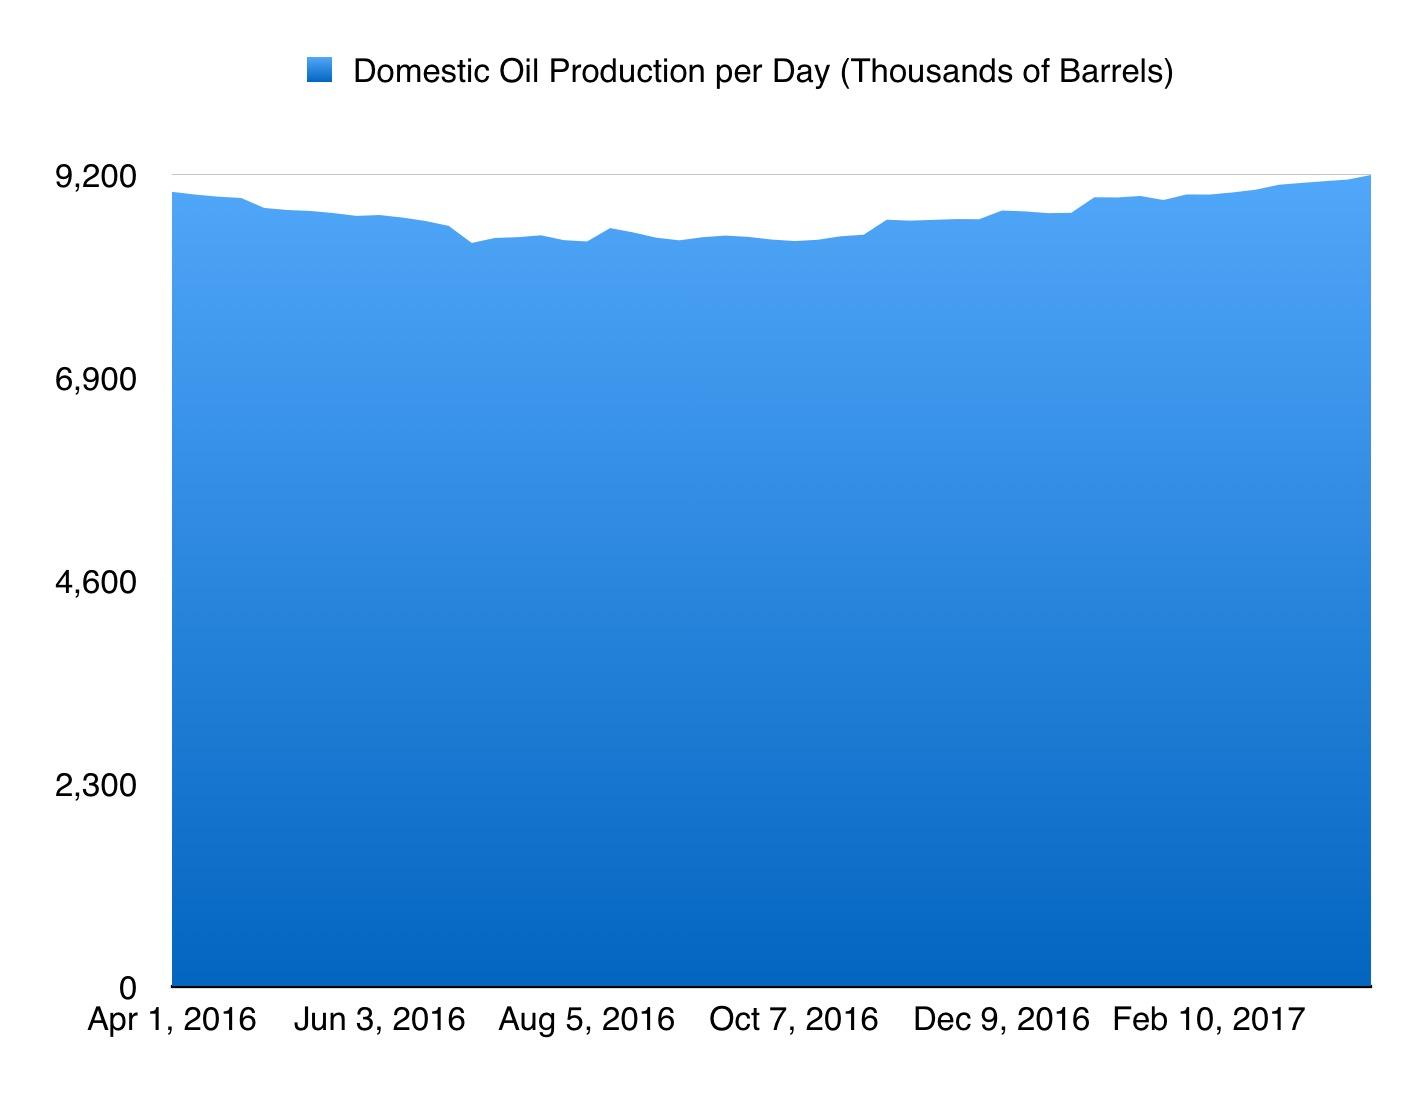
*Created by Author
Even though domestic production figures were bearish, the EIA did report some bullish data relating to demand. Motor gasoline demand, while still weak, came in at 9.245 million barrels per day, a very modest uptick over the 9.224 million barrels per day seen the same week last year. That said, the four-week average is still down, 0.6% lower than last year’s figure. Even so, this kind of shortfall is far better than it has been for much of this year. Meanwhile, distillate fuel demand has remained a powerhouse. Using the four-week average, consumption is at 4.185 million barrels per day. This represents a year-over-year increase of 13.9% compared to the 3.675 million barrels per day seen last year.
Another week of a mixed rig count
After seeing all of the above data come in mixed, investors shouldn’t be surprised to see the same thing regarding the oil rig count. According to Baker Hughes (NYSE:BHI), the US oil rig count ticked up by 10 units from 662 to 672. This is bearish but what’s more bearish is the fact that, last year, the rig count stood at a modest 354 units. Though this is all bad, the Canadian oil rig count has seen yet another week of declines, falling 13 units to 42 in operation. Having said this, the Canadian data is bittersweet. This is because, just last year, the count was a measly 8 units.
A warning for oil watchers
In the past, the biggest contributors, usually, to the oil market’s uncertainty, on a week-to-week basis, has been a mix of production and demand. Now that production is on a pretty reliable uptrend and so long as demand doesn’t do anything wacky, however, I suspect that this picture will be different for the foreseeable future. This all boils down to one thing: crude export uncertainty.
You see, in the past, the amount of oil being exported from the US has been heavily restricted by the federal government (exceptions were made for crude to be exported some places, largely Canada). The roots of this can be traced back to 1975, but, in December of 2015, the government decided to lift the ban. Last year, we didn’t really see any impact from the lift but, so far this year, we have seen a lot of volatility in this space. Take, for instance, the graph below, which shows weekly crude export estimates this year compared to 2015 and 2016. The data in question covers the first 14 weeks of each year.
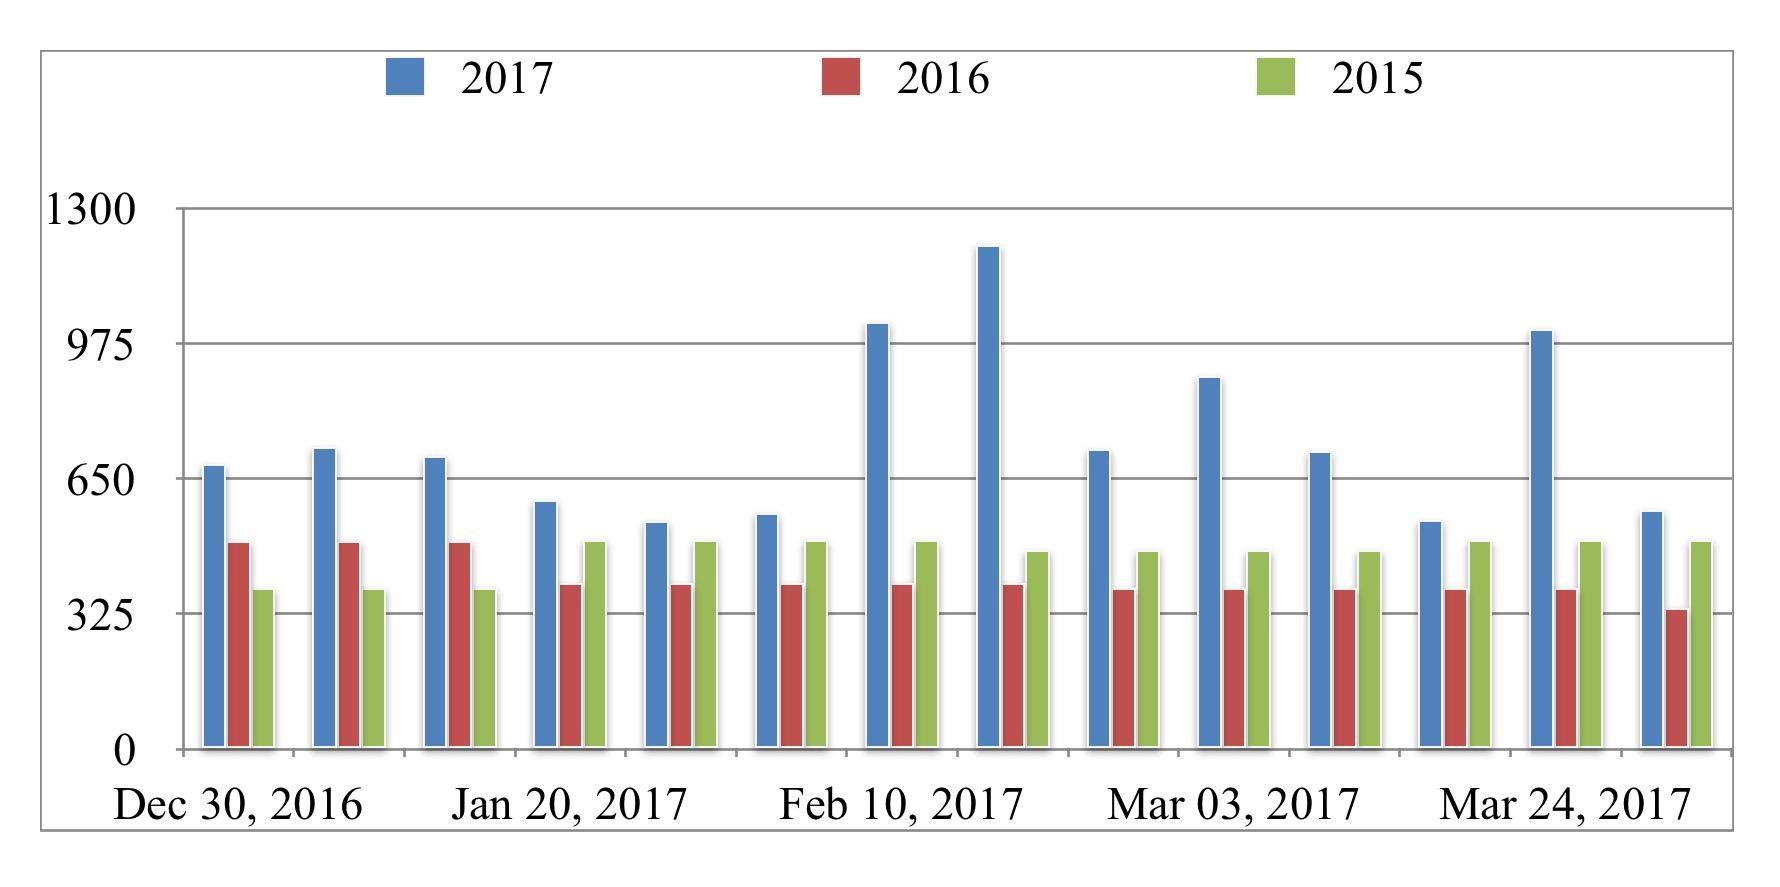
*Created by Author
Undoubtedly, this is a sizable change and is something that should, keeping all else the same, make it easier for the oil market to rebalance. However, what we have seen so far this year has been a trade that has seen wild fluctuations. This past week’s data, for instance, shows that crude exports totaled 575 thousand barrels per day. A week earlier, that number was 1.01 million barrels per day, and the week before that it was 550 thousand barrels per day.
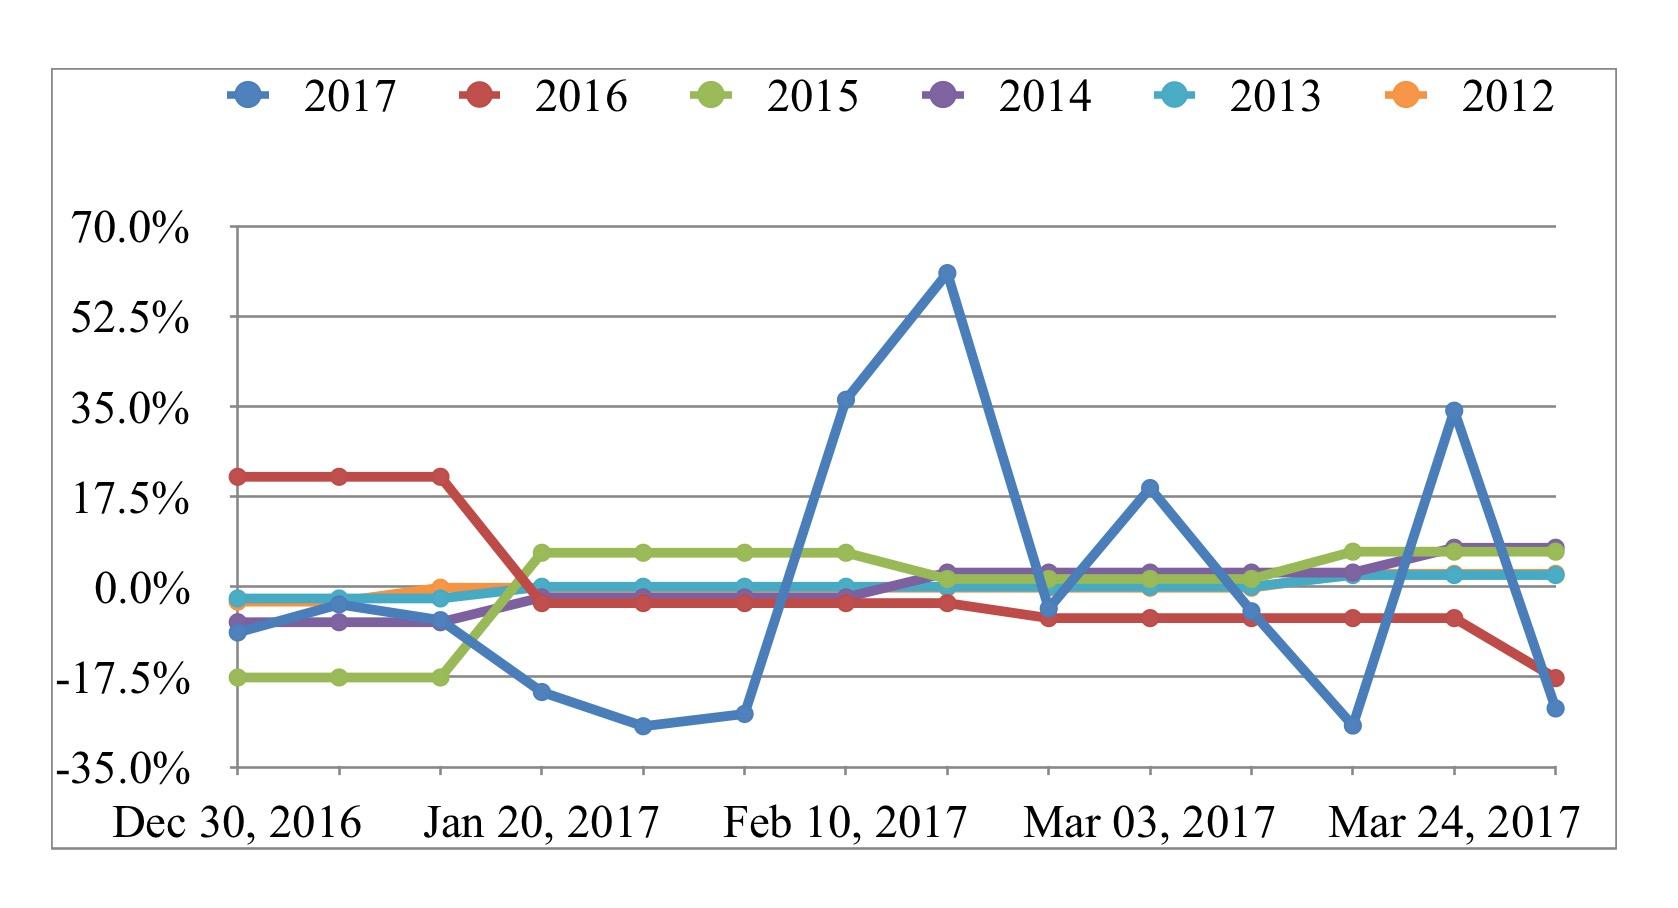
*Created by Author
To show just how volatile the market has been, I created the graph above. In it, you can see the fluctuation from the mean this year shown by crude exports. This compares to each of the past five years. The blue line, which represents 2017, is enough to see that investors would be wise to anticipate this kind of volatility for the foreseeable future. What this all means, in my opinion, is that we shouldn’t be surprised to see such wild misses in terms of crude storage levels vs. what the API and analysts anticipate. After all, the difference between the EIA’s estimates and the API’s could have been accounted for if crude exports had been lower by 471 thousand barrels per day last week. For the average of analysts’ estimates, the drop required would have been just 236 thousand barrels per day.
Takeaway
Based on the data provided, it’s clear that there was a lot of mixed oil data over the past week. Personally, and approaching this from the most unbiased perspective possible, I would say that the results were a bit more bearish than bullish, but not everything was depressing. Demand figures, which show firming motor gasoline demand and robust distillate fuel consumption, are encouraging. Even though Canada’s rig count is very seasonal in nature and investors should be prepared for wild swings, the fact that we saw yet another week of declines was mildly positive too. Moving forward, we should also keep in mind that the massive change in the crude export market this year compared to last may also add some uncertainty into the mix in the weeks and months to come.
7 Comments on "Oil – Expect More Uncertainty"
penury on Mon, 10th Apr 2017 8:48 pm
There is an interesting article on “Seeking Alpha” on “Zero Hedge”today if any are interested.
rockman on Mon, 10th Apr 2017 9:59 pm
“…in the past, the amount of oil being exported from the US has been heavily restricted by the federal government (exceptions were made for crude to be exported some places, largely Canada). The roots of this can be traced back to 1975…”. And it never fails: even when some writers put out some valid info they just can’t avoid repeating the same bullsh*t other writers toss out. There have never been any restrictions to exporting US oil let alone being “heavily restricted”. In fact, in the 15 years immediately after the so called ban was signed oil exports where more then 15X greater the during the 15 years before the “ban” became law.
https://www.eia.gov/dnav/pet/hist/LeafHandler.ashx?n=pet&s=mcrexus2&f=m
And compound this bullsh*t about oil exports this incompetent misses the truly important stat: in Jan 2017 the US exported 746,000 bbls per day of oil. But during the same month we exported 4,950,000 bbls per day of refinery products.
https://www.eia.gov/dnav/pet/pet_move_exp_dc_NUS-Z00_mbblpd_m.htm
I’m sure many are as tired of hearing those FACTS as the Rockman is repeating them. But we have new folks joining all the time.
Dredd on Tue, 11th Apr 2017 8:45 am
What uncertainty … Oil-Qaeda is quite the kid, without any self-doubt (MOMCOM In The Outer Limits Of The Twilight Zone).
rockman on Tue, 11th Apr 2017 8:52 am
Also: “More uncertainty”. Right! After personally dealing with volatility of the oil patch for more then 4 decades that phrase strikes me the same as someone saying a woman is “more pregnant “. LOL. Suddenly some mental midgets have discovered the volatility of the oil biz. Since Col. Drake poked that first hole more then 100 years ago there has been one constant certainty: the future is not at all certain.
Apneaman on Tue, 11th Apr 2017 10:56 am
More incompetence from the Cancer “professionals”.
TransCanada shuts down Keystone after oil seeps to surface
Leak discovered by passerby
“My understanding is that it was a passerby that observed it and called the company,” said Nelson, chairman of the South Dakota Public Utilities Commission.
If confirmed, this would mean that the company’s leak detection system failed to identify the incident.”
http://www.nationalobserver.com/2016/04/04/news/transcanada-shuts-down-keystone-after-oil-seeps-surface
Apneaman on Tue, 11th Apr 2017 12:51 pm
The TransCanada shuts down Keystone after oil seeps to surface story -Last year – my bad.
This cancer tale is recent.
Shell corruption probe: New evidence on oil payments
http://www.bbc.com/news/business-39544761
Nony on Thu, 13th Apr 2017 6:31 pm
“heavily restricted” and “mostly to Canada” is completely on target.